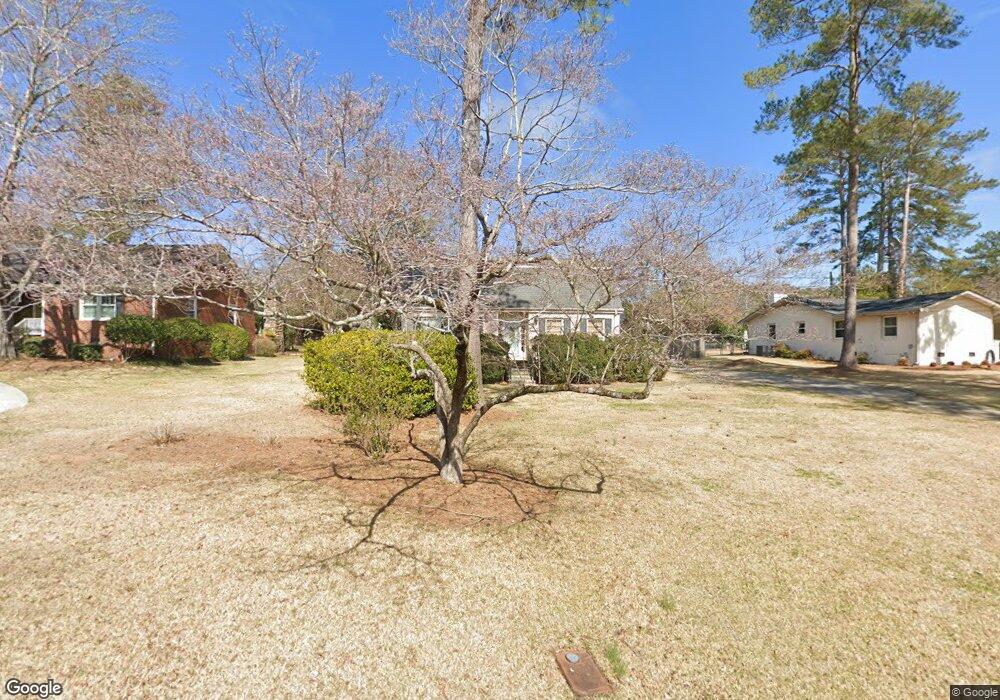
1122 Placid Rd Griffin, GA 30224
Spalding County NeighborhoodEstimated Value: $299,935 - $367,000
3
Beds
3
Baths
2,492
Sq Ft
$135/Sq Ft
Est. Value
About This Home
This home is located at 1122 Placid Rd, Griffin, GA 30224 and is currently estimated at $335,484, approximately $134 per square foot. 1122 Placid Rd is a home located in Spalding County with nearby schools including Futral Road Elementary School, Rehoboth Road Middle School, and Spalding High School.
Ownership History
Date
Name
Owned For
Owner Type
Purchase Details
Closed on
Jul 13, 2018
Sold by
Mays Misty Jay
Bought by
Murphy Amy Tinely
Current Estimated Value
Home Financials for this Owner
Home Financials are based on the most recent Mortgage that was taken out on this home.
Original Mortgage
$184,203
Outstanding Balance
$159,992
Interest Rate
4.6%
Mortgage Type
New Conventional
Estimated Equity
$175,492
Purchase Details
Closed on
Jun 4, 2002
Sold by
Gaissert Betty M
Bought by
Mays Misty J and Mays Robert L
Home Financials for this Owner
Home Financials are based on the most recent Mortgage that was taken out on this home.
Original Mortgage
$148,951
Interest Rate
6.85%
Mortgage Type
FHA
Purchase Details
Closed on
May 6, 1972
Sold by
Singletary Horace K
Bought by
Bonds Neal A and Bonds Elaine M
Purchase Details
Closed on
Oct 5, 1971
Sold by
Anderson Jerry E
Bought by
Singletary Horace K
Purchase Details
Closed on
Aug 12, 1969
Sold by
Bailey N H
Bought by
Anderson Jerry E
Create a Home Valuation Report for This Property
The Home Valuation Report is an in-depth analysis detailing your home's value as well as a comparison with similar homes in the area
Home Values in the Area
Average Home Value in this Area
Purchase History
| Date | Buyer | Sale Price | Title Company |
|---|---|---|---|
| Murphy Amy Tinely | $189,900 | -- | |
| Mays Misty J | $153,800 | -- | |
| Bonds Neal A | $35,000 | -- | |
| Singletary Horace K | $3,600 | -- | |
| Anderson Jerry E | $3,000 | -- |
Source: Public Records
Mortgage History
| Date | Status | Borrower | Loan Amount |
|---|---|---|---|
| Open | Murphy Amy Tinely | $184,203 | |
| Previous Owner | Mays Misty J | $148,951 |
Source: Public Records
Tax History Compared to Growth
Tax History
| Year | Tax Paid | Tax Assessment Tax Assessment Total Assessment is a certain percentage of the fair market value that is determined by local assessors to be the total taxable value of land and additions on the property. | Land | Improvement |
|---|---|---|---|---|
| 2024 | $4,245 | $111,178 | $14,000 | $97,178 |
| 2023 | $4,245 | $111,178 | $14,000 | $97,178 |
| 2022 | $3,892 | $97,402 | $13,200 | $84,202 |
| 2021 | $3,632 | $90,894 | $13,200 | $77,694 |
| 2020 | $3,632 | $90,894 | $13,200 | $77,694 |
| 2019 | $3,091 | $78,504 | $9,240 | $69,264 |
| 2018 | $2,316 | $57,193 | $9,240 | $47,953 |
| 2017 | $2,301 | $57,956 | $9,240 | $48,716 |
| 2016 | $1,958 | $48,981 | $9,240 | $39,741 |
| 2015 | $1,990 | $48,981 | $9,240 | $39,741 |
| 2014 | $2,049 | $48,981 | $9,240 | $39,741 |
Source: Public Records
Map
Nearby Homes
- 611 Grandview Dr
- 1120 Russell Dr
- 523 Ivy Rd
- 936 Springer Dr
- 1104 Maple Dr
- 941 Springer Dr
- 922 Springer Dr
- 945 Finley St
- 874 Crescent Ln Unit 52
- 1440 Wesley Dr
- 1099 Pine Valley Rd
- 405 Crescent Ct
- 1471 Macon Rd
- 850 Crescent Ln
- 524 Kincaid Ave
- 0 Martin Luther King jr Pkwy Unit 19-41 BYPASS HIGHWAY
- 831 Bel Air Cir
- 861 Crescent Ln
- 1463 Gloria St
- 859 Crescent Ln
- 1120 Placid Rd
- 1124 Placid Rd
- 1109 Lake Placid Dr
- 1126 Placid Rd
- 1108 Placid Rd
- 1121 Placid Rd
- 1105 Lake Placid Dr
- 1106 Placid Rd
- 1125 Placid Rd
- 0 Lake Placid Dr Unit 7558915
- 1104 Placid Rd
- 1127 Placid Rd
- 1119 Placid Rd
- 1103 Lake Placid Dr
- 1102 Placid Rd
- 1117 Placid Rd
- 1128 Placid Rd
- 1129 Placid Rd
- 1115 Placid Rd
- 1101 Lake Placid Dr