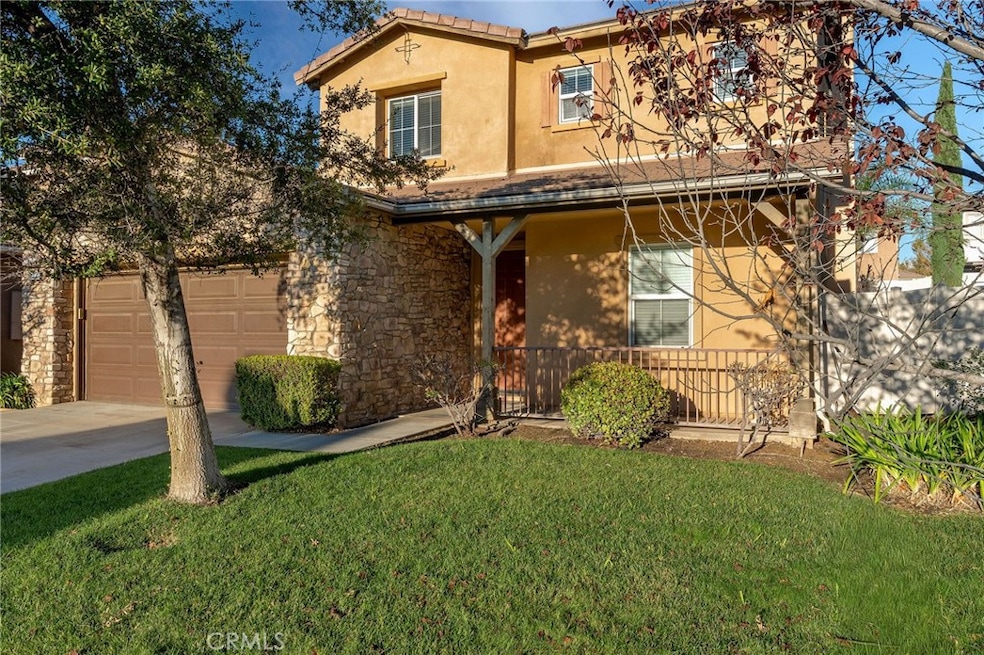
11220 Casper Cove Beaumont, CA 92223
Fairway Canyon NeighborhoodEstimated payment $3,586/month
Highlights
- Open Floorplan
- Mediterranean Architecture
- Community Pool
- Main Floor Bedroom
- Neighborhood Views
- Open to Family Room
About This Home
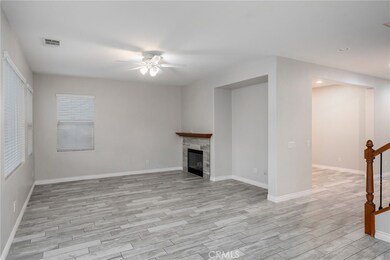
Welcome to your stunning residence nestled within the highly sought-after Fairway Canyon Community.
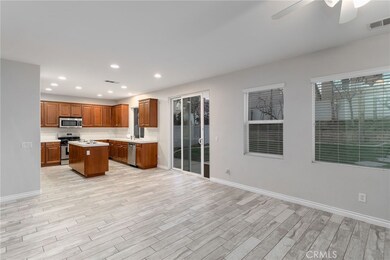
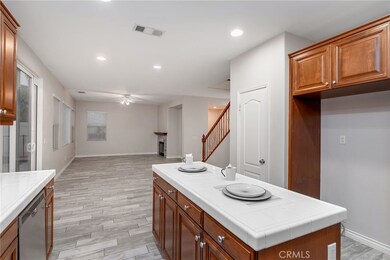
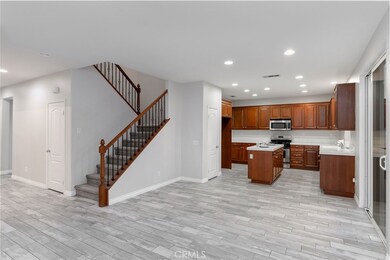
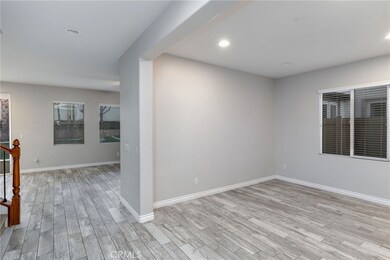
This beautifully appointed home features four generous bedrooms and three well-designed bathrooms, with one of the bedrooms on the main floor, offering comfort, style, and functionality throughout. As you enter, you are greeted by a elegant formal dining room perfect for memorable gatherings. The heart of the home is the expansive open-concept family room, seamlessly connected to an well designed kitchen with expansive counter space—an inviting space for cooking, entertaining, and everyday living. Step outside to your private, serene backyard—a spacious retreat ideal for hosting celebrations, relaxing with loved ones, or simply enjoying peaceful moments outdoors. And yes, this exceptional property is located on a quiet cul-de-sac, making it the perfect blend of privacy and charm. Living in Fairway Canyon means access to exclusive community amenities including the Canyon Club, featuring two swimming pools, a spa, fitness center, meeting rooms, and multiple parks and walking trails. You're also conveniently located near shopping, dining, schools, and major freeways.
Listing Agent
BERKSHIRE HATHAWAY HOMESERVICES CALIFORNIA REALTY Brokerage Phone: 909-844-0279 License #01505033 Listed on: 11/21/2025

Open House Schedule
-
Friday, November 28, 202512:00 to 2:00 pm11/28/2025 12:00:00 PM +00:0011/28/2025 2:00:00 PM +00:00Add to Calendar
-
Saturday, November 29, 202512:00 to 2:00 pm11/29/2025 12:00:00 PM +00:0011/29/2025 2:00:00 PM +00:00Add to Calendar
Home Details
Home Type
- Single Family
Est. Annual Taxes
- $7,597
Year Built
- Built in 2006
Lot Details
- 6,098 Sq Ft Lot
- Vinyl Fence
- Front Yard Sprinklers
- Density is up to 1 Unit/Acre
HOA Fees
- $155 Monthly HOA Fees
Parking
- 3 Car Attached Garage
- Parking Available
- Front Facing Garage
- Driveway
Home Design
- Mediterranean Architecture
- Entry on the 1st floor
- Planned Development
- Tile Roof
Interior Spaces
- 2,332 Sq Ft Home
- 2-Story Property
- Open Floorplan
- Ceiling Fan
- Recessed Lighting
- Family Room with Fireplace
- Family Room Off Kitchen
- Dining Room
- Neighborhood Views
- Termite Clearance
- Laundry Room
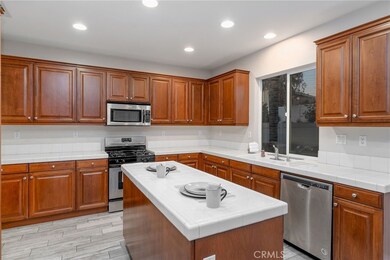
Kitchen
- Open to Family Room
- Eat-In Kitchen
- Gas Range
- Dishwasher
- Kitchen Island
- Tile Countertops
Flooring
- Carpet
- Laminate
- Tile
Bedrooms and Bathrooms
- 4 Bedrooms | 1 Main Level Bedroom
- Bathroom on Main Level
- 3 Full Bathrooms
- Bathtub with Shower
Outdoor Features
- Patio
- Front Porch
Location
- Suburban Location
Schools
- Beaumont High School
Utilities
- Evaporated cooling system
- Central Heating and Cooling System
- Natural Gas Connected
Listing and Financial Details
- Tax Lot 115
- Tax Tract Number 31462
- Assessor Parcel Number 413551026
- $3,500 per year additional tax assessments
Community Details
Overview
- Fairway Canyon Association, Phone Number (951) 922-6444
- First Residential HOA
Recreation
- Community Pool
- Community Spa
Map
Home Values in the Area
Average Home Value in this Area
Tax History
| Year | Tax Paid | Tax Assessment Tax Assessment Total Assessment is a certain percentage of the fair market value that is determined by local assessors to be the total taxable value of land and additions on the property. | Land | Improvement |
|---|---|---|---|---|
| 2025 | $7,597 | $271,054 | $90,346 | $180,708 |
| 2023 | $7,597 | $260,531 | $86,839 | $173,692 |
| 2022 | $6,546 | $255,424 | $85,137 | $170,287 |
| 2021 | $6,484 | $250,417 | $83,468 | $166,949 |
| 2020 | $6,506 | $247,851 | $82,613 | $165,238 |
| 2019 | $7,555 | $242,993 | $80,994 | $161,999 |
| 2018 | $7,295 | $238,229 | $79,407 | $158,822 |
| 2017 | $6,715 | $233,558 | $77,850 | $155,708 |
| 2016 | $7,745 | $228,979 | $76,324 | $152,655 |
| 2015 | $7,785 | $225,542 | $75,179 | $150,363 |
| 2014 | $7,055 | $221,125 | $73,707 | $147,418 |
Property History
| Date | Event | Price | List to Sale | Price per Sq Ft |
|---|---|---|---|---|
| 11/21/2025 11/21/25 | For Sale | $529,900 | -- | $227 / Sq Ft |
Purchase History
| Date | Type | Sale Price | Title Company |
|---|---|---|---|
| Deed | -- | None Listed On Document | |
| Grant Deed | $210,000 | Fidelity National Title Co | |
| Trustee Deed | $171,100 | Fidelity National Title Co | |
| Grant Deed | $380,000 | Chicago Title |
Mortgage History
| Date | Status | Loan Amount | Loan Type |
|---|---|---|---|
| Previous Owner | $157,500 | New Conventional | |
| Previous Owner | $303,761 | Purchase Money Mortgage |
Source: California Regional Multiple Listing Service (CRMLS)
MLS Number: IV25263995
APN: 413-551-026
Disclaimer: Certain information contained herein is derived from information provided by parties other than Homes.com. All information provided is deemed reliable, but is not guaranteed to be accurate and should be independently verified.
![]() The multiple listing data appearing on this website, or contained in reports produced therefrom, is owned and copyrighted by California Regional Multiple Listing Service, Inc. ("CRMLS") and is protected by all applicable copyright laws. Information provided is for viewer's personal, non-commercial use and may not be used for any purpose other than to identify prospective properties the viewer may be interested in purchasing. All listing data, including but not limited to square footage and lot size is believed to be accurate, but the listing Agent, listing Broker and CRMLS and its affiliates do not warrant or guarantee such accuracy. The viewer should independently verify the listed data prior to making any decisions based on such information by personal inspection and/or contacting a real estate professional.
The multiple listing data appearing on this website, or contained in reports produced therefrom, is owned and copyrighted by California Regional Multiple Listing Service, Inc. ("CRMLS") and is protected by all applicable copyright laws. Information provided is for viewer's personal, non-commercial use and may not be used for any purpose other than to identify prospective properties the viewer may be interested in purchasing. All listing data, including but not limited to square footage and lot size is believed to be accurate, but the listing Agent, listing Broker and CRMLS and its affiliates do not warrant or guarantee such accuracy. The viewer should independently verify the listed data prior to making any decisions based on such information by personal inspection and/or contacting a real estate professional.
Based on information from California Regional Multiple Listing Service, Inc. and /or other sources. All data, including all measurements and calculations of area, is obtained from various sources and has not been, and will not be, verified by broker or MLS. All information should be independently reviewed and verified for accuracy. Properties may or may not be listed by the office/agent presenting the information
- 11345 Sanders St
- 11656 Dalton Way
- 35354 Price St
- 35187 Funk Way
- 35619 Byron Trail
- 35983 Michelle Ln
- 1156 Poinsettia Cir
- 10961 Desert Lawn Dr Unit 334
- 10961 Desert Lawn Dr Unit 21
- 10961 Desert Lawn Dr Unit 370
- 10961 Desert Lawn Dr Unit 331
- 10961 Desert Lawn Dr Unit 199
- 10961 Desert Lawn Dr Unit 413
- 10961 Desert Lawn Dr Unit 162
- 10961 Desert Lawn Dr Unit 249
- 10961 Desert Lawn Dr Unit 143
- 10961 Desert Lawn Dr Unit 453
- 10961 Desert Lawn Dr Unit 433
- 10961 Desert Lawn Dr Unit 26
- 10961 Desert Lawn Dr Unit 101
- 35448 Price St
- 36719 Torrey Pines Dr
- 38209 Divot Dr
- 34194 Ogrady Ct
- 10750 Union St
- 1760 Sarazen St
- 1054 Brady Ln
- 1685 Rose Ave
- 700 Aspen Glen Ln
- 723 Greenwood St
- 34232 County Line Rd
- 13404 Limestone Dr
- 1373 San Miguel Dr
- 34254 Rosemont Dr
- 1026 Wellwood Ave
- 13195 Bryant St
- 701 Euclid Ave
- 12951 Cascade St
- 952 E 10th St
- 1332 Rover Ln Unit E