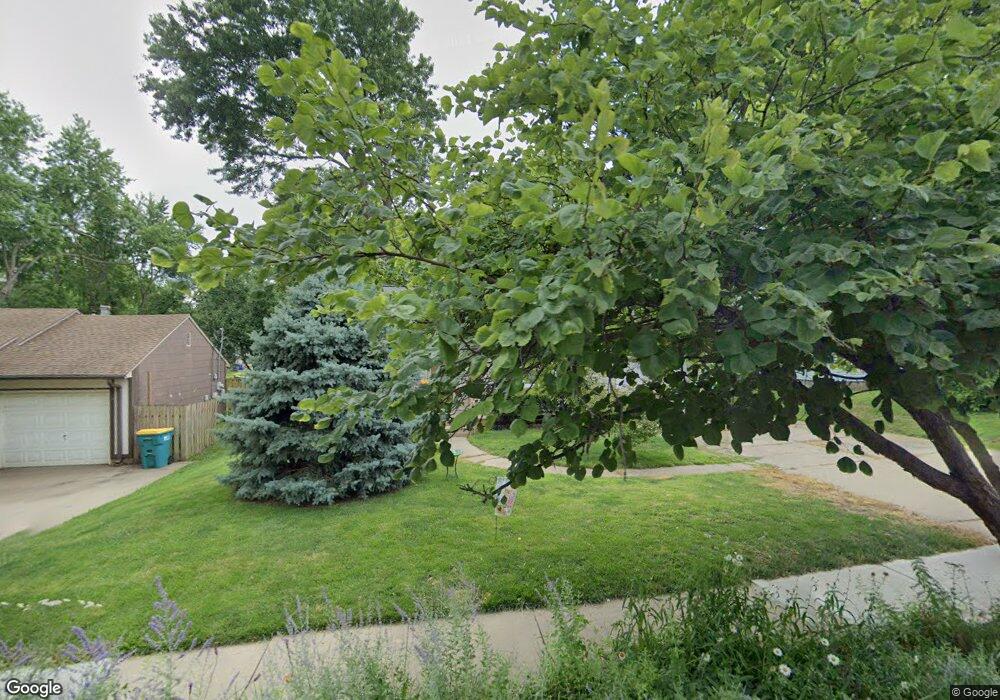
11221 W 67th St Shawnee, KS 66203
Estimated Value: $226,000 - $248,000
2
Beds
1
Bath
768
Sq Ft
$311/Sq Ft
Est. Value
About This Home
This home is located at 11221 W 67th St, Shawnee, KS 66203 and is currently estimated at $239,002, approximately $311 per square foot. 11221 W 67th St is a home located in Johnson County with nearby schools including Nieman Elementary School, Hocker Grove Middle School, and Shawnee Mission North High School.
Ownership History
Date
Name
Owned For
Owner Type
Purchase Details
Closed on
Oct 7, 2009
Sold by
Boyce Joyce and Boyce Douglas
Bought by
Boyce Douglas and Boyce Joyce
Current Estimated Value
Home Financials for this Owner
Home Financials are based on the most recent Mortgage that was taken out on this home.
Original Mortgage
$99,250
Outstanding Balance
$65,073
Interest Rate
5.16%
Mortgage Type
New Conventional
Estimated Equity
$173,929
Purchase Details
Closed on
Sep 9, 2006
Sold by
Boyce Douglas
Bought by
Boyce Joyce and Boyce Douglas
Purchase Details
Closed on
Jul 22, 2004
Sold by
Byrne Patricia S
Bought by
Boyce Douglas
Home Financials for this Owner
Home Financials are based on the most recent Mortgage that was taken out on this home.
Original Mortgage
$106,288
Interest Rate
6.3%
Mortgage Type
VA
Create a Home Valuation Report for This Property
The Home Valuation Report is an in-depth analysis detailing your home's value as well as a comparison with similar homes in the area
Home Values in the Area
Average Home Value in this Area
Purchase History
| Date | Buyer | Sale Price | Title Company |
|---|---|---|---|
| Boyce Douglas | -- | All American Title Company | |
| Boyce Joyce | -- | None Available | |
| Boyce Douglas | -- | Chicago Title Ins Co |
Source: Public Records
Mortgage History
| Date | Status | Borrower | Loan Amount |
|---|---|---|---|
| Open | Boyce Douglas | $99,250 | |
| Previous Owner | Boyce Douglas | $106,288 |
Source: Public Records
Tax History Compared to Growth
Tax History
| Year | Tax Paid | Tax Assessment Tax Assessment Total Assessment is a certain percentage of the fair market value that is determined by local assessors to be the total taxable value of land and additions on the property. | Land | Improvement |
|---|---|---|---|---|
| 2024 | $2,415 | $23,219 | $4,485 | $18,734 |
| 2023 | $2,285 | $21,413 | $4,485 | $16,928 |
| 2022 | $2,001 | $19,539 | $3,923 | $15,616 |
| 2021 | $1,975 | $17,123 | $3,405 | $13,718 |
| 2020 | $1,831 | $16,928 | $3,095 | $13,833 |
| 2019 | $1,896 | $16,203 | $2,807 | $13,396 |
| 2018 | $1,719 | $14,616 | $2,563 | $12,053 |
| 2017 | $1,625 | $13,593 | $2,563 | $11,030 |
| 2016 | $1,549 | $12,788 | $2,563 | $10,225 |
| 2015 | $1,443 | $12,512 | $2,563 | $9,949 |
| 2013 | -- | $11,914 | $2,563 | $9,351 |
Source: Public Records
Map
Nearby Homes
- 11217 W 69th Terrace
- 10924 W 67th St
- 11637 W 68th Terrace
- 11406 W 71st St
- 10914 W 71st St
- 6420 Ballentine St
- 7107 Garnett St
- 6610 Halsey St
- 10902 W 71st Place
- 12300 W 67th Terrace
- 6564 Charles St
- 6556 Charles St
- 10235 W 70th St
- 7219 Reeder St
- 12225 W 64th Terrace
- 10406 W 71st Place
- 12116 W 63rd Terrace
- 10024 W 70th Terrace
- 7226 Edgewood Blvd
- 10236 Edelweiss Cir
- 11215 W 67th St
- 11301 W 67th St
- 11211 W 67th St
- 11220 W 67th Terrace
- 11224 W 67th Terrace
- 11216 W 67th Terrace
- 11307 W 67th St
- 11205 W 67th St
- 11210 W 67th Terrace
- 11220 W 67th St
- 11214 W 67th St
- 11224 W 67th St
- 11306 W 67th Terrace
- 11202 W 67th Terrace
- 11125 W 67th St
- 11313 W 67th St
- 11302 W 67th St
- 11312 W 67th Terrace
- 6720 Barton Dr
- 11308 W 67th St