
Landlord's Agent in 2015
Suhile Alami
Real Broker, LLC
(703) 899-1210
92 Total Sales


Estimated Value: $289,000 - $460,000
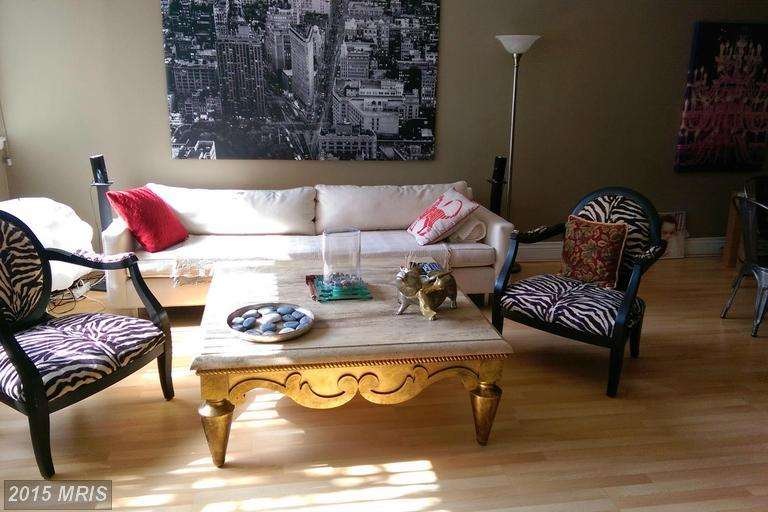
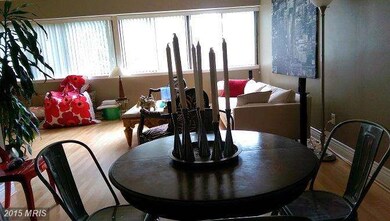
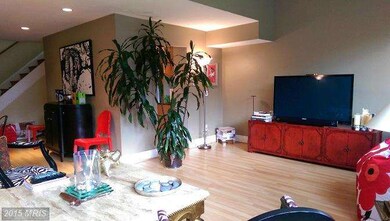
RARE OPPORTUNITY!. ALL UTLIITIES INCLUDED except cable/internet . 7 minute walk to the new SILVER line Metro on Wiehle Ave. 4 minute walk to W & OD Trail. Wired for Verizon FIOS. ADT security already installed and available. Condo has a town house feel with balcony and extremely close to Reston Town Center. Must see to truly appreciate! Call/text listing agent for lock combination.
Last Agent to Rent the Property
(703) 899-1210 adam.alami23@gmail.com Real Broker, LLC Listed on: 11/19/2014
Home Type
Condominium
Est. Annual Taxes
$4,308
Year Built
1972
Lot Details
0
| Date | Buyer | Sale Price | Title Company |
|---|---|---|---|
| Edoh Komland | $193,400 | -- | |
| Pareja Reynaldo | $178,000 | -- | |
| Lanning Kurt N | $73,500 | -- |
| Date | Status | Borrower | Loan Amount |
|---|---|---|---|
| Open | Pareja Reynaldo | $154,720 | |
| Previous Owner | Pareja Reynaldo | $173,000 |
| Date | Event | Price | List to Sale | Price per Sq Ft |
|---|---|---|---|---|
| 04/30/2015 04/30/15 | Off Market | $2,500 | -- | -- |
| 04/28/2015 04/28/15 | Rented | $2,500 | 0.0% | -- |
| 11/19/2014 11/19/14 | For Rent | $2,500 | -- | -- |
| Year | Tax Paid | Tax Assessment Tax Assessment Total Assessment is a certain percentage of the fair market value that is determined by local assessors to be the total taxable value of land and additions on the property. | Land | Improvement |
|---|---|---|---|---|
| 2025 | $4,308 | $353,800 | $71,000 | $282,800 |
| 2024 | $4,308 | $357,370 | $71,000 | $286,370 |
| 2023 | $4,201 | $357,370 | $71,000 | $286,370 |
| 2022 | $3,799 | $319,080 | $64,000 | $255,080 |
| 2021 | $3,640 | $298,210 | $60,000 | $238,210 |
| 2020 | $3,528 | $286,740 | $57,000 | $229,740 |
| 2019 | $3,271 | $265,800 | $54,000 | $211,800 |
| 2018 | $2,906 | $252,710 | $51,000 | $201,710 |
| 2017 | $3,634 | $300,850 | $60,000 | $240,850 |
| 2016 | $3,339 | $276,980 | $55,000 | $221,980 |
| 2015 | $3,504 | $301,280 | $60,000 | $241,280 |
| 2014 | $3,496 | $301,280 | $60,000 | $241,280 |
Landlord's Agent in 2015
Suhile Alami
Real Broker, LLC
(703) 899-1210
92 Total Sales
Tenant's Agent in 2015
Jalal Achir
Samson Properties
(703) 623-4667
1 in this area
16 Total Sales
Source: Bright MLS
MLS Number: FX8505822
APN: 0174-22-0328
Disclaimer: Certain information contained herein is derived from information provided by parties other than Homes.com. All information provided is deemed reliable, but is not guaranteed to be accurate and should be independently verified.
![]() The data relating to real estate for sale on this website appears in part through the BRIGHT Internet Data Exchange program, a voluntary cooperative exchange of property listing data between licensed real estate brokerage firms, and is provided by BRIGHT through a licensing agreement.
The data relating to real estate for sale on this website appears in part through the BRIGHT Internet Data Exchange program, a voluntary cooperative exchange of property listing data between licensed real estate brokerage firms, and is provided by BRIGHT through a licensing agreement.
Listing information is from various brokers who participate in the Bright MLS IDX program and not all listings may be visible on the site.
The property information being provided on or through the website is for the personal, non-commercial use of consumers and such information may not be used for any purpose other than to identify prospective properties consumers may be interested in purchasing.
Some properties which appear for sale on the website may no longer be available because they are for instance, under contract, sold or are no longer being offered for sale.
Property information displayed is deemed reliable but is not guaranteed.
Copyright 2025 Bright MLS, Inc.