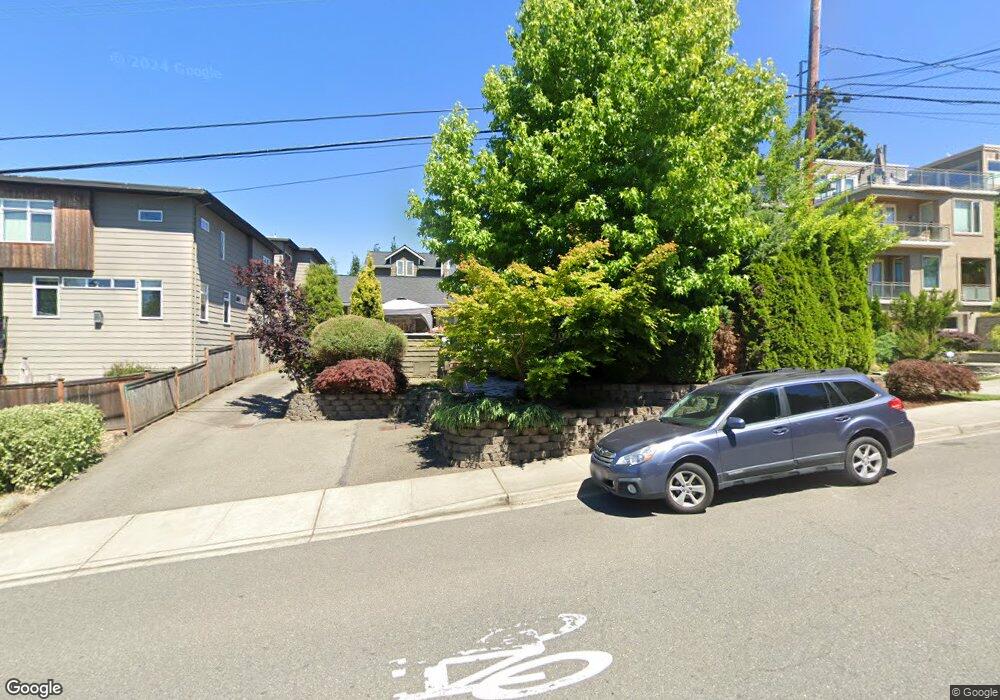
11224 NE 87th St Unit 2A Kirkland, WA 98033
Highlands NeighborhoodEstimated Value: $813,000 - $1,399,000
3
Beds
2
Baths
1,344
Sq Ft
$752/Sq Ft
Est. Value
About This Home
This home is located at 11224 NE 87th St Unit 2A, Kirkland, WA 98033 and is currently estimated at $1,010,562, approximately $751 per square foot. 11224 NE 87th St Unit 2A is a home located in King County with nearby schools including Peter Kirk Elementary School, Kirkland Middle School, and Lake Washington High School.
Ownership History
Date
Name
Owned For
Owner Type
Purchase Details
Closed on
Jul 28, 2014
Sold by
Kearney Properties Llc
Bought by
Mceachran Shawn
Current Estimated Value
Home Financials for this Owner
Home Financials are based on the most recent Mortgage that was taken out on this home.
Original Mortgage
$417,000
Outstanding Balance
$330,945
Interest Rate
5.25%
Mortgage Type
Adjustable Rate Mortgage/ARM
Estimated Equity
$679,617
Purchase Details
Closed on
Sep 21, 2009
Sold by
Roberts Dawn
Bought by
Kearney Properties Llc
Purchase Details
Closed on
Jun 23, 2008
Sold by
Kearney Properties Llc
Bought by
Fox Roberts Dawn
Home Financials for this Owner
Home Financials are based on the most recent Mortgage that was taken out on this home.
Original Mortgage
$459,000
Interest Rate
5.99%
Create a Home Valuation Report for This Property
The Home Valuation Report is an in-depth analysis detailing your home's value as well as a comparison with similar homes in the area
Home Values in the Area
Average Home Value in this Area
Purchase History
| Date | Buyer | Sale Price | Title Company |
|---|---|---|---|
| Mceachran Shawn | $706,000 | Rainier Title | |
| Kearney Properties Llc | -- | None Available | |
| Fox Roberts Dawn | $479,000 | Rainier Title |
Source: Public Records
Mortgage History
| Date | Status | Borrower | Loan Amount |
|---|---|---|---|
| Open | Mceachran Shawn | $417,000 | |
| Previous Owner | Fox Roberts Dawn | $459,000 |
Source: Public Records
Tax History Compared to Growth
Tax History
| Year | Tax Paid | Tax Assessment Tax Assessment Total Assessment is a certain percentage of the fair market value that is determined by local assessors to be the total taxable value of land and additions on the property. | Land | Improvement |
|---|---|---|---|---|
| 2024 | $5,925 | $709,000 | $346,500 | $362,500 |
| 2023 | $5,082 | $708,000 | $346,500 | $361,500 |
| 2022 | $5,473 | $651,000 | $280,500 | $370,500 |
| 2021 | $5,268 | $599,000 | $237,600 | $361,400 |
| 2020 | $5,310 | $530,000 | $237,600 | $292,400 |
| 2018 | $5,002 | $594,000 | $237,600 | $356,400 |
| 2017 | $3,758 | $481,000 | $231,000 | $250,000 |
| 2016 | $2,886 | $372,000 | $191,400 | $180,600 |
| 2015 | $3,666 | $277,000 | $174,900 | $102,100 |
| 2014 | -- | $346,000 | $165,000 | $181,000 |
| 2013 | -- | $294,000 | $165,000 | $129,000 |
Source: Public Records
Map
Nearby Homes
- 8630 113th Ln NE
- 8707 116th Ave NE Unit (A)
- 412 10th St Unit B202
- 13131 NE 87th Ln
- 13115 NE 87th Ln
- 13119 NE 87th Ln
- 820 3rd Ave Unit B204
- 828 2nd Ave
- 830 Kirkland Way Unit 202
- 830 Kirkland Way Unit 204
- 710 Kirkland Cir Unit A101
- 638 11th Ave
- 636 11th Ave
- 845 Kirkland Way
- 639 12th Ave
- 138 8th Ct
- 11217 NE 95th St
- 11217 NE 95th St Unit B
- 11217 NE 95th St
- 134 8th Ct
- 11224 NE 87th St
- 11224 NE 87th St Unit B
- 11224 NE 87th St Unit A
- 11226 NE 87th St
- 11218 NE 87th St Unit 1
- 11218 NE 87th St
- 11214 NE 87th St
- 11230 NE 87th St
- 11210 NE 87th St
- 11234 NE 87th St
- 11217 NE 88th St
- 11219 NE 88th St
- 11223 NE 88th St
- 11211 NE 88th St Unit A
- 11211 NE 88th St Unit B
- 11211 NE 88th St
- 11221 NE 88th St
- 8633 113th Ln NE
- 8633 113th Ln NE Unit 2
- 11227 NE 88th St