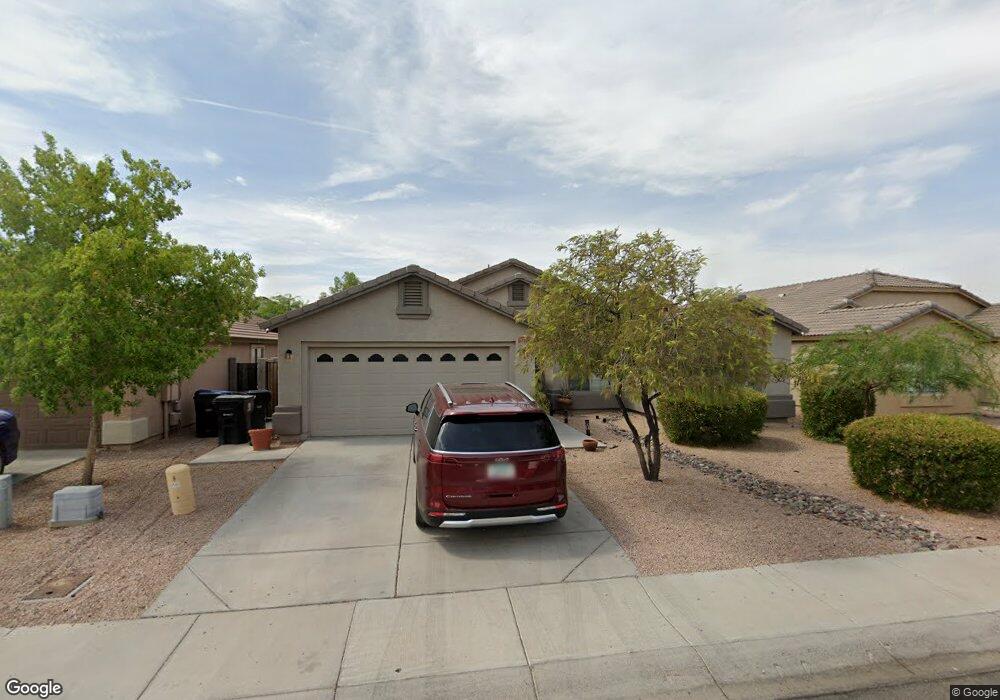
11225 W Chase Ln Avondale, AZ 85323
Avondale Gateway NeighborhoodEstimated Value: $352,821 - $407,000
4
Beds
2
Baths
2,016
Sq Ft
$193/Sq Ft
Est. Value
About This Home
This home is located at 11225 W Chase Ln, Avondale, AZ 85323 and is currently estimated at $389,455, approximately $193 per square foot. 11225 W Chase Ln is a home located in Maricopa County with nearby schools including Quentin Elementary School, La Joya Community High School, and Academies of Math and Science Avondale.
Ownership History
Date
Name
Owned For
Owner Type
Purchase Details
Closed on
Oct 6, 2020
Sold by
Freo Progress Llc
Bought by
Progress Residential Borrower 2 Llc
Current Estimated Value
Purchase Details
Closed on
Mar 20, 2020
Sold by
Frame Brent and Frame Monica
Bought by
Freo Progress Llc
Purchase Details
Closed on
Jul 7, 2005
Sold by
Sunstone Homes Llc
Bought by
Frame Brent D and Frame Monica
Home Financials for this Owner
Home Financials are based on the most recent Mortgage that was taken out on this home.
Original Mortgage
$143,150
Interest Rate
6%
Mortgage Type
Purchase Money Mortgage
Create a Home Valuation Report for This Property
The Home Valuation Report is an in-depth analysis detailing your home's value as well as a comparison with similar homes in the area
Home Values in the Area
Average Home Value in this Area
Purchase History
| Date | Buyer | Sale Price | Title Company |
|---|---|---|---|
| Progress Residential Borrower 2 Llc | -- | Servicelink Llc | |
| Freo Progress Llc | $242,500 | Magnus Title Agency | |
| Frame Brent D | $178,981 | -- |
Source: Public Records
Mortgage History
| Date | Status | Borrower | Loan Amount |
|---|---|---|---|
| Previous Owner | Frame Brent D | $143,150 |
Source: Public Records
Tax History Compared to Growth
Tax History
| Year | Tax Paid | Tax Assessment Tax Assessment Total Assessment is a certain percentage of the fair market value that is determined by local assessors to be the total taxable value of land and additions on the property. | Land | Improvement |
|---|---|---|---|---|
| 2025 | $1,655 | $12,756 | -- | -- |
| 2024 | $1,694 | $12,148 | -- | -- |
| 2023 | $1,694 | $30,770 | $6,150 | $24,620 |
| 2022 | $1,685 | $22,860 | $4,570 | $18,290 |
| 2021 | $1,622 | $21,370 | $4,270 | $17,100 |
| 2020 | $1,566 | $19,030 | $3,800 | $15,230 |
| 2019 | $1,560 | $17,150 | $3,430 | $13,720 |
| 2018 | $1,438 | $16,000 | $3,200 | $12,800 |
| 2017 | $1,344 | $14,150 | $2,830 | $11,320 |
| 2016 | $1,264 | $13,200 | $2,640 | $10,560 |
| 2015 | $1,236 | $12,900 | $2,580 | $10,320 |
Source: Public Records
Map
Nearby Homes
- 2318 S 113th Ave
- 2117 S 114th Ave
- 1922 S 111th Ave Unit 26
- 11426 W Chase Dr
- 1902 S 111th Ave
- 11218 W Mohave St
- 11167 W Elm Ln
- 11405 W Mohave St
- 11383 W Pima St
- 11123 W Pima St
- 10947 W Mohave St
- 10917 W Apache St
- 11429 W Yavapai St
- 11358 W Yuma St
- 11594 W Mountain View Dr
- 11610 W Pima St
- 11623 W Cocopah St
- 128XX W Buckeye Rd
- 11742 W Chase Ln
- 11765 W Overlin Ln
- 11225 W Chase Dr
- 11229 W Chase Dr
- 11221 W Chase Dr
- 11221 W Chase Ln
- 11233 W Chase Dr
- 2202 S 112th Dr
- 2201 S 112th Dr
- 11226 W Chase Dr
- 11237 W Chase Dr
- 11222 W Chase Dr
- 11213 W Chase Dr
- 11230 W Chase Dr
- 11230 W Chase Ln
- 2206 S 112th Dr
- 11218 W Chase Dr
- 11234 W Chase Dr
- 2205 S 112th Dr
- 11241 W Chase Dr
- 11209 W Chase Dr
- 11214 W Chase Dr