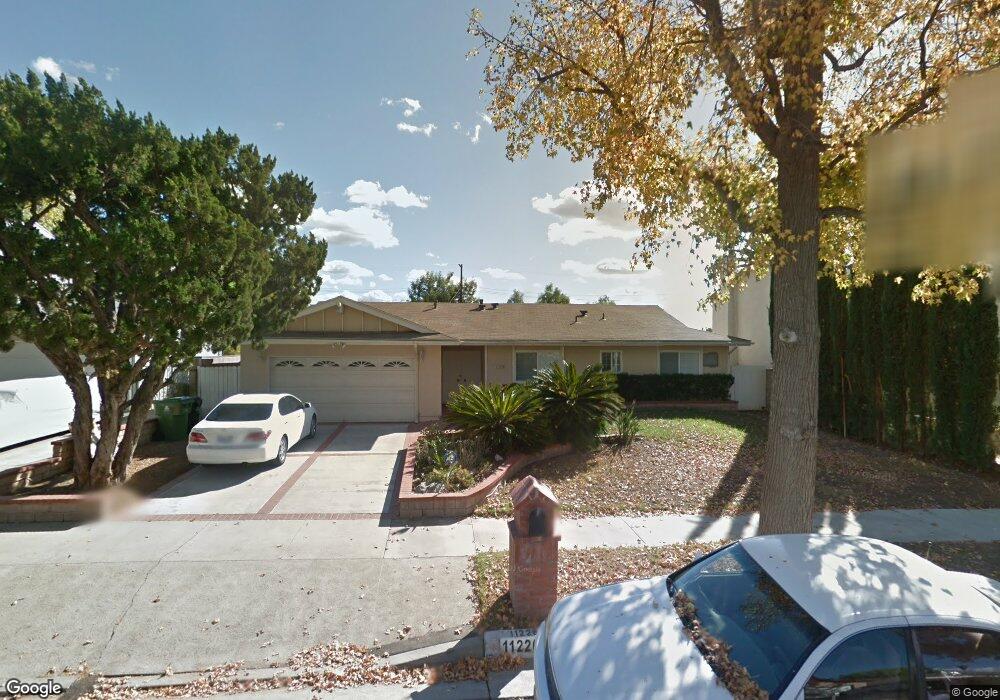
11226 Kamloops St Sylmar, CA 91342
Estimated Value: $860,050 - $928,000
4
Beds
2
Baths
1,594
Sq Ft
$563/Sq Ft
Est. Value
About This Home
This home is located at 11226 Kamloops St, Sylmar, CA 91342 and is currently estimated at $897,263, approximately $562 per square foot. 11226 Kamloops St is a home located in Los Angeles County with nearby schools including Brainard Elementary School, Charles Maclay Middle School, and Mt. Gleason Middle School.
Ownership History
Date
Name
Owned For
Owner Type
Purchase Details
Closed on
Aug 28, 2014
Sold by
Goshman Steve L
Bought by
Joseph Lonnie and Joseph Stacy
Current Estimated Value
Home Financials for this Owner
Home Financials are based on the most recent Mortgage that was taken out on this home.
Original Mortgage
$392,755
Interest Rate
4.12%
Mortgage Type
FHA
Purchase Details
Closed on
Oct 29, 2006
Sold by
Goshman Dorothy and Goshman Robert
Bought by
Goshman Dorothy
Create a Home Valuation Report for This Property
The Home Valuation Report is an in-depth analysis detailing your home's value as well as a comparison with similar homes in the area
Home Values in the Area
Average Home Value in this Area
Purchase History
| Date | Buyer | Sale Price | Title Company |
|---|---|---|---|
| Joseph Lonnie | $400,000 | Stewart Title | |
| Goshman Dorothy | -- | None Available |
Source: Public Records
Mortgage History
| Date | Status | Borrower | Loan Amount |
|---|---|---|---|
| Previous Owner | Joseph Lonnie | $392,755 |
Source: Public Records
Tax History Compared to Growth
Tax History
| Year | Tax Paid | Tax Assessment Tax Assessment Total Assessment is a certain percentage of the fair market value that is determined by local assessors to be the total taxable value of land and additions on the property. | Land | Improvement |
|---|---|---|---|---|
| 2025 | $6,035 | $480,729 | $341,320 | $139,409 |
| 2024 | $6,035 | $471,304 | $334,628 | $136,676 |
| 2023 | $5,923 | $462,064 | $328,067 | $133,997 |
| 2022 | $5,655 | $453,005 | $321,635 | $131,370 |
| 2021 | $5,582 | $444,124 | $315,329 | $128,795 |
| 2019 | $5,420 | $430,953 | $305,977 | $124,976 |
| 2018 | $5,345 | $422,504 | $299,978 | $122,526 |
| 2016 | $5,104 | $406,100 | $288,331 | $117,769 |
| 2015 | $5,032 | $400,000 | $284,000 | $116,000 |
| 2014 | $945 | $61,749 | $15,773 | $45,976 |
Source: Public Records
Map
Nearby Homes
- 11235 Sunburst St
- 11569 Bonham Ave
- 11609 Garrick Ave
- 11377 Osborne Place Unit 34
- 12008 East Trail
- 11350 Foothill Blvd Unit 15
- 11350 Foothill Blvd Unit 30
- 11715 Garrick Ave
- 12047 Kagel Canyon Rd
- 11300 Foothill Blvd Unit 30
- 12055 Kagel Canyon Rd
- 11555 Eldridge Ave
- 11645 N Delft Ln
- 11374 Hela Ave
- 12133 East Trail
- 0 Terra Vista Way
- 0 Spring Trail Unit PW21185754
- 12300 Spring Trail
- 0 Kagel Canyon Unit 25533613
- 10824 Foothill Blvd
- 11220 Kamloops St
- 11234 Kamloops St
- 11212 Kamloops St
- 11209 Sunburst St
- 11201 Sunburst St
- 11215 Sunburst St
- 11229 Kamloops St
- 11221 Kamloops St
- 11254 Kamloops St
- 11235 Kamloops St
- 11609 Biltmore Ave
- 11639 Biltmore Ave
- 11625 Biltmore Ave
- 11213 Kamloops St
- 11221 Sunburst St
- 11243 Kamloops St
- 11601 Biltmore Ave
- 11300 Kamloops St
- 11249 Kamloops St
- 11628 & 11630 Biltmore Ave