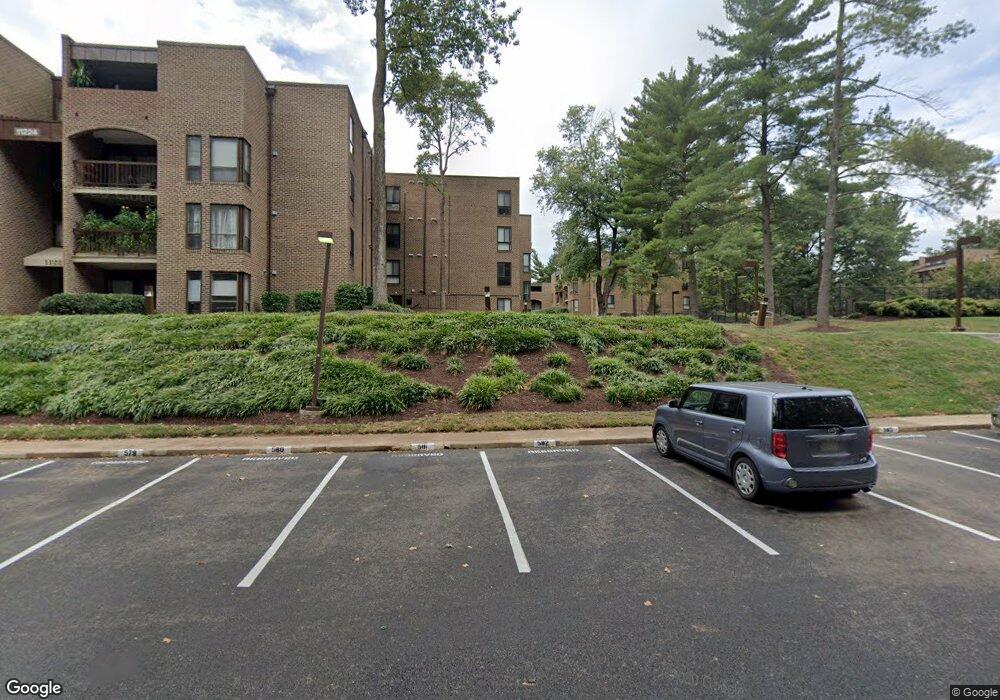
11228 Chestnut Grv Square Unit 329 Reston, VA 20190
Tall Oaks/Uplands NeighborhoodEstimated Value: $381,000 - $436,000
4
Beds
3
Baths
1,860
Sq Ft
$217/Sq Ft
Est. Value
About This Home
This home is located at 11228 Chestnut Grv Square Unit 329, Reston, VA 20190 and is currently estimated at $404,488, approximately $217 per square foot. 11228 Chestnut Grv Square Unit 329 is a home located in Fairfax County with nearby schools including Sunrise Valley Elementary, South Lakes High School, and Reston Montessori School.
Ownership History
Date
Name
Owned For
Owner Type
Purchase Details
Closed on
Mar 22, 2017
Sold by
Miklos Brian M and Miklos Abigail S
Bought by
Alter Mark and Alter Naree K
Current Estimated Value
Home Financials for this Owner
Home Financials are based on the most recent Mortgage that was taken out on this home.
Original Mortgage
$182,000
Outstanding Balance
$150,840
Interest Rate
4.15%
Mortgage Type
New Conventional
Estimated Equity
$253,648
Purchase Details
Closed on
Jan 13, 2006
Sold by
Donovan April Nance
Bought by
Miklos Brian M
Home Financials for this Owner
Home Financials are based on the most recent Mortgage that was taken out on this home.
Original Mortgage
$288,000
Interest Rate
6.28%
Mortgage Type
New Conventional
Purchase Details
Closed on
Apr 5, 2001
Sold by
Silcox Hugh B
Bought by
Teich Mary S
Home Financials for this Owner
Home Financials are based on the most recent Mortgage that was taken out on this home.
Original Mortgage
$112,100
Interest Rate
6.9%
Create a Home Valuation Report for This Property
The Home Valuation Report is an in-depth analysis detailing your home's value as well as a comparison with similar homes in the area
Home Values in the Area
Average Home Value in this Area
Purchase History
| Date | Buyer | Sale Price | Title Company |
|---|---|---|---|
| Alter Mark | $260,000 | The Settlement Group Inc | |
| Miklos Brian M | $360,000 | -- | |
| Teich Mary S | $120,000 | -- |
Source: Public Records
Mortgage History
| Date | Status | Borrower | Loan Amount |
|---|---|---|---|
| Open | Alter Mark | $182,000 | |
| Previous Owner | Miklos Brian M | $288,000 | |
| Previous Owner | Teich Mary S | $112,100 |
Source: Public Records
Tax History Compared to Growth
Tax History
| Year | Tax Paid | Tax Assessment Tax Assessment Total Assessment is a certain percentage of the fair market value that is determined by local assessors to be the total taxable value of land and additions on the property. | Land | Improvement |
|---|---|---|---|---|
| 2025 | $4,308 | $353,800 | $71,000 | $282,800 |
| 2024 | $4,308 | $357,370 | $71,000 | $286,370 |
| 2023 | $4,201 | $357,370 | $71,000 | $286,370 |
| 2022 | $3,799 | $319,080 | $64,000 | $255,080 |
| 2021 | $3,640 | $298,210 | $60,000 | $238,210 |
| 2020 | $3,528 | $286,740 | $57,000 | $229,740 |
| 2019 | $3,271 | $265,800 | $54,000 | $211,800 |
| 2018 | $2,906 | $252,710 | $51,000 | $201,710 |
| 2017 | $3,634 | $300,850 | $60,000 | $240,850 |
| 2016 | $3,339 | $276,980 | $55,000 | $221,980 |
| 2015 | $3,504 | $301,280 | $60,000 | $241,280 |
| 2014 | $3,496 | $301,280 | $60,000 | $241,280 |
Source: Public Records
Map
Nearby Homes
- 11200 Chestnut Grove Square Unit 203
- 11260 Chestnut Grove Square Unit 339
- 1670 Parkcrest Cir Unit 3B/300
- 1656 Parkcrest Cir Unit 2D/301
- 1623 Parkcrest Cir Unit 9B/300
- 1820 Reston Row Plaza Unit 1604
- 1704 Bandit Loop Unit 20A
- 1806 N Shore Ct
- 11430 Links Dr
- 1526 Park Glen Ct
- 11221 S Shore Rd
- 1840 Golf View Ct
- 11650 American Dream Way
- 10900 Sunset Hills Rd
- 11648 American Dream Way
- 11646 American Dream Way
- 2037 Wethersfield Ct
- 2029 Wethersfield Ct
- 11638 American Dream Way
- 11500 Fairway Dr Unit 402
- 11228 Chestnut Grove Square Unit 329
- 11228 Chestnut Grove Square Unit 131
- 11228 Chestnut Grove Square Unit 232
- 11228 Chestnut Grove Square Unit 229
- 11228 Chestnut Grove Square Unit 129
- 11228 Chestnut Grove Square Unit 231
- 11228 Chestnut Grv Square Unit 230
- 11228 Chestnut Grove Square Unit 130
- 11228 Chestnut Grv Square Unit 231
- 11228 Chestnut Grove Square Unit 11228-129
- 11228 Chestnut Grv Square Unit 229
- 11228 Chestnut Grv Square Unit 132
- 11228 Chestnut Grv Square Unit 232
- 11228 Chestnut Grv Square Unit 131
- 11228 Chestnut Grove Square Unit 132
- 11228 Chestnut Grove Square Unit 230
- 11224 Chestnut Grove Square Unit 14
- 11224 Chestnut Grove Square Unit 225
- 11224 Chestnut Grove Square Unit 325
- 11224 Chestnut Grv Square Unit 14