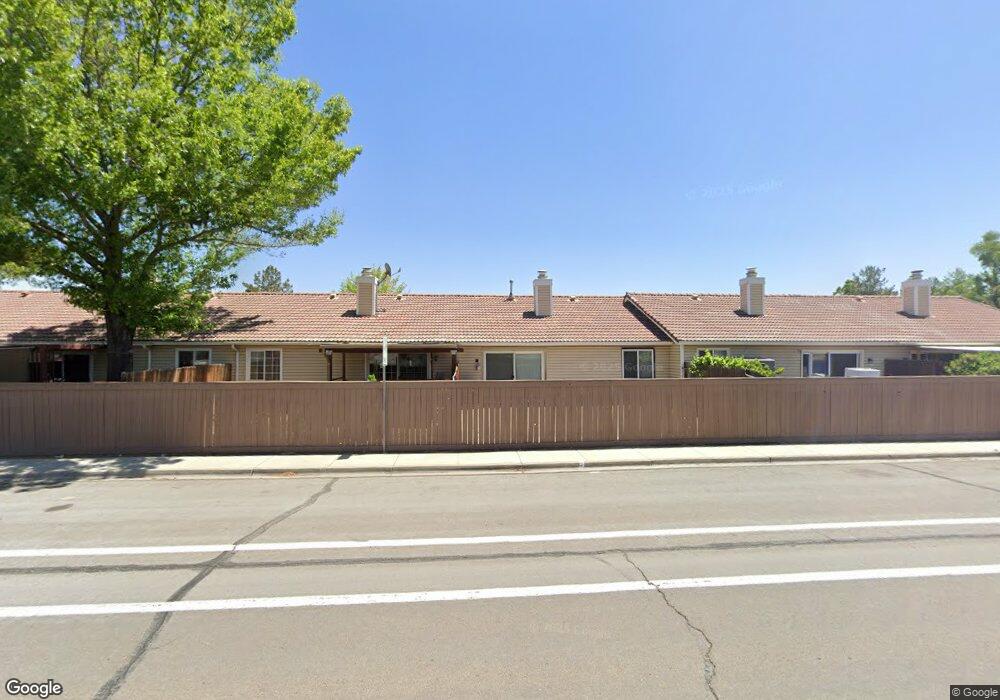
1123 Bradley Square Sparks, NV 89434
Reed NeighborhoodEstimated Value: $206,000 - $295,000
2
Beds
1
Bath
952
Sq Ft
$272/Sq Ft
Est. Value
About This Home
This home is located at 1123 Bradley Square, Sparks, NV 89434 and is currently estimated at $258,597, approximately $271 per square foot. 1123 Bradley Square is a home located in Washoe County with nearby schools including Lena Juniper Elementary School, Lou Mendive Middle School, and Edward C Reed High School.
Ownership History
Date
Name
Owned For
Owner Type
Purchase Details
Closed on
Apr 28, 2022
Sold by
Smith Shayel
Bought by
Bucio Atl
Current Estimated Value
Home Financials for this Owner
Home Financials are based on the most recent Mortgage that was taken out on this home.
Original Mortgage
$150,000
Outstanding Balance
$140,279
Interest Rate
4.16%
Mortgage Type
Seller Take Back
Estimated Equity
$118,318
Purchase Details
Closed on
Jun 21, 1999
Sold by
Freeman W M and Freeman Phyllis J
Bought by
Miller Peggy F
Home Financials for this Owner
Home Financials are based on the most recent Mortgage that was taken out on this home.
Original Mortgage
$65,000
Interest Rate
7.01%
Create a Home Valuation Report for This Property
The Home Valuation Report is an in-depth analysis detailing your home's value as well as a comparison with similar homes in the area
Home Values in the Area
Average Home Value in this Area
Purchase History
| Date | Buyer | Sale Price | Title Company |
|---|---|---|---|
| Bucio Atl | -- | First Centennial Title | |
| Bucio Atl | $200,000 | First Centennial Title | |
| Miller Peggy F | $83,000 | First Centennial Title Co |
Source: Public Records
Mortgage History
| Date | Status | Borrower | Loan Amount |
|---|---|---|---|
| Open | Bucio Atl | $150,000 | |
| Closed | Bucio Atl | $150,000 | |
| Previous Owner | Miller Peggy F | $65,000 |
Source: Public Records
Tax History
| Year | Tax Paid | Tax Assessment Tax Assessment Total Assessment is a certain percentage of the fair market value that is determined by local assessors to be the total taxable value of land and additions on the property. | Land | Improvement |
|---|---|---|---|---|
| 2026 | $884 | $40,463 | $23,835 | $16,628 |
| 2025 | $1,460 | $40,990 | $23,835 | $17,155 |
| 2024 | $1,460 | $39,842 | $21,630 | $18,212 |
| 2023 | $761 | $39,165 | $22,680 | $16,485 |
| 2022 | $705 | $29,379 | $14,875 | $14,504 |
| 2021 | $653 | $28,620 | $13,790 | $14,830 |
| 2020 | $632 | $28,927 | $13,790 | $15,137 |
| 2019 | $614 | $27,318 | $12,460 | $14,858 |
| 2018 | $596 | $23,075 | $8,330 | $14,745 |
| 2017 | $579 | $22,035 | $7,140 | $14,895 |
| 2016 | $566 | $21,999 | $6,650 | $15,349 |
| 2015 | $564 | $18,259 | $3,255 | $15,004 |
| 2014 | $548 | $18,529 | $3,045 | $15,484 |
| 2013 | -- | $17,516 | $2,870 | $14,646 |
Source: Public Records
Map
Nearby Homes
- 1029 Baywood Dr Unit D
- 1041 Baywood Dr Unit D
- 1074 Glen Martin Dr
- 1069 Palmwood Dr
- 2575 Howard Dr
- 913 Glen Molly Dr
- 930 Spanish Springs Rd
- 889 Glen Molly Dr
- 867 Spanish Springs Rd
- 3126 N Truckee Ln
- 2679 Sycamore Glen Dr Unit 4
- 2363 William Morby Dr
- 2659 Sycamore Glen Dr Unit 5
- 3122 Shari Way
- 2183 La Hacienda Dr
- 3273 N Truckee Ln
- 2207 Howard Dr
- 2507 Sycamore Glen Dr Unit 5
- 3104 Sandy St
- 491 E Emerson Way
- 1125 Bradley Square
- 1119 Bradley Square
- 1127 Bradley Square
- 1117 Bradley Square
- 1122 Bradley Square
- 1115 Bradley Square
- 1124 Bradley Square
- 1120 Bradley Square
- 1118 Bradley Square
- 1116 Bradley Square
- 1126 Bradley Square
- 1113 Bradley Square
- 1112 Bradley Square
- 1001 Bradley Square
- 1001 Bradley Square Unit 1
- 1003 Bradley Square
- 1012 Bradley Square
- 1110 Bradley Square
- 999 Ashwood Cir
- 995 Ashwood Cir
Your Personal Tour Guide
Ask me questions while you tour the home.