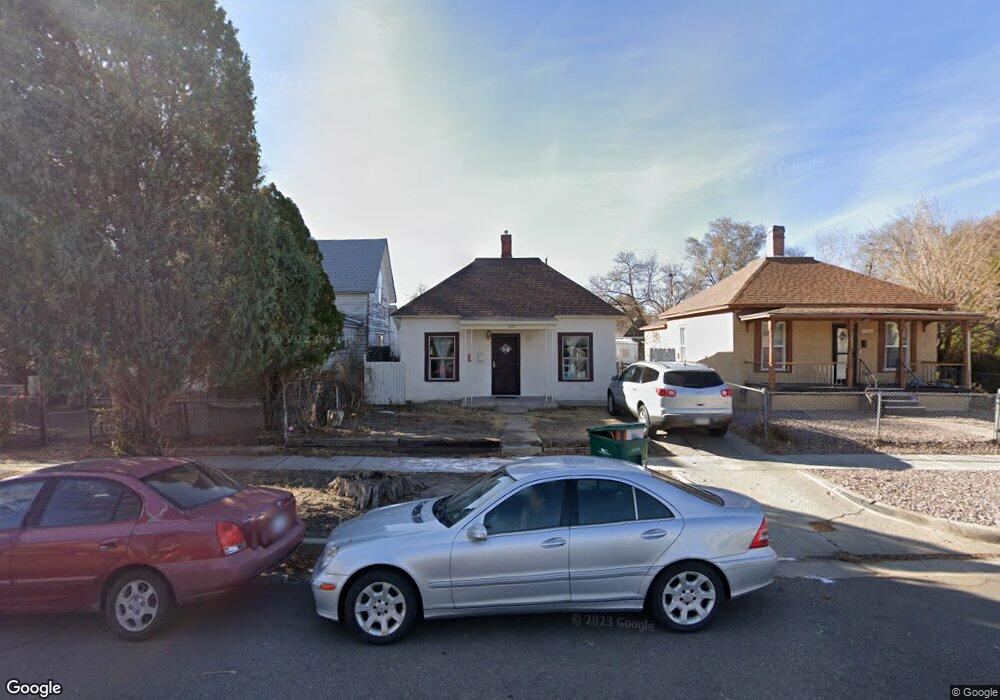
1123 Cypress St Pueblo, CO 81004
Bessemer NeighborhoodEstimated Value: $117,962 - $158,000
2
Beds
1
Bath
816
Sq Ft
$167/Sq Ft
Est. Value
About This Home
This home is located at 1123 Cypress St, Pueblo, CO 81004 and is currently estimated at $136,241, approximately $166 per square foot. 1123 Cypress St is a home located in Pueblo County with nearby schools including Bessemer Elementary School, Pueblo Academy of Arts, and Central High School.
Ownership History
Date
Name
Owned For
Owner Type
Purchase Details
Closed on
Jul 14, 1998
Sold by
Garcia Jose
Bought by
Garcia Jose + Lydia M
Current Estimated Value
Purchase Details
Closed on
Apr 29, 1998
Sold by
Garcia Jose + Lydia M
Bought by
Garcia Jose
Purchase Details
Closed on
Oct 2, 1996
Sold by
Crespin Christine C
Bought by
Garcia Jose + Lydia M
Purchase Details
Closed on
Jun 5, 1992
Sold by
Shaw Elizabeth A
Bought by
Crespin Christine C
Purchase Details
Closed on
Jan 17, 1985
Sold by
Shaw Elizabeth A and Shaw Donnell O
Bought by
Shaw Elizabeth A
Purchase Details
Closed on
Mar 12, 1984
Sold by
Shaw Elizabeth A
Bought by
Shaw Elizabeth A and Shaw Donnell O
Purchase Details
Closed on
May 9, 1983
Sold by
Massarotti
Bought by
Shaw Elizabeth A
Purchase Details
Closed on
Jan 10, 1980
Sold by
Brodie James R + Jennie
Bought by
Massarotti M + A
Purchase Details
Closed on
Jan 4, 1980
Sold by
Smith Ellis B + Margaret J
Bought by
Brodie James R + Jennie
Purchase Details
Closed on
Jul 23, 1968
Sold by
Ashford Lawrence + Ada F
Bought by
Smith Ellis B + Margaret J
Create a Home Valuation Report for This Property
The Home Valuation Report is an in-depth analysis detailing your home's value as well as a comparison with similar homes in the area
Home Values in the Area
Average Home Value in this Area
Purchase History
| Date | Buyer | Sale Price | Title Company |
|---|---|---|---|
| Garcia Jose + Lydia M | -- | -- | |
| Garcia Jose | -- | -- | |
| Garcia Jose + Lydia M | -- | -- | |
| Crespin Christine C | $25,000 | -- | |
| Shaw Elizabeth A | -- | -- | |
| Shaw Elizabeth A | -- | -- | |
| Shaw Elizabeth A | $11,000 | -- | |
| Massarotti M + A | $20,000 | -- | |
| Brodie James R + Jennie | -- | -- | |
| Smith Ellis B + Margaret J | $2,200 | -- |
Source: Public Records
Tax History Compared to Growth
Tax History
| Year | Tax Paid | Tax Assessment Tax Assessment Total Assessment is a certain percentage of the fair market value that is determined by local assessors to be the total taxable value of land and additions on the property. | Land | Improvement |
|---|---|---|---|---|
| 2024 | $468 | $4,700 | -- | -- |
| 2023 | $472 | $8,390 | $1,010 | $7,380 |
| 2022 | $441 | $4,446 | $450 | $3,996 |
| 2021 | $455 | $4,570 | $460 | $4,110 |
| 2020 | $324 | $4,570 | $460 | $4,110 |
| 2019 | $324 | $3,213 | $174 | $3,039 |
| 2018 | $235 | $2,594 | $176 | $2,418 |
| 2017 | $237 | $2,594 | $176 | $2,418 |
| 2016 | $222 | $2,439 | $194 | $2,245 |
| 2015 | $221 | $2,439 | $194 | $2,245 |
| 2014 | $234 | $2,583 | $194 | $2,389 |
Source: Public Records
Map
Nearby Homes
- 1121 Cypress St
- 1125 Cypress St
- 1117 Cypress St
- 1129 Cypress St
- 1120 Stone Ave
- 1118 Stone Ave
- 1115 Cypress St
- 1124 Stone Ave
- 1137 Cypress St
- 1116 Stone Ave
- 1126 Stone Ave
- 1113 Cypress St
- 1122 Cypress St
- 1124 Cypress St
- 1120 Cypress St
- 1118 Cypress St
- 1111 Cypress St
- 1126 Cypress St
- 1015 W Mesa Ave
- 1128 Cypress St