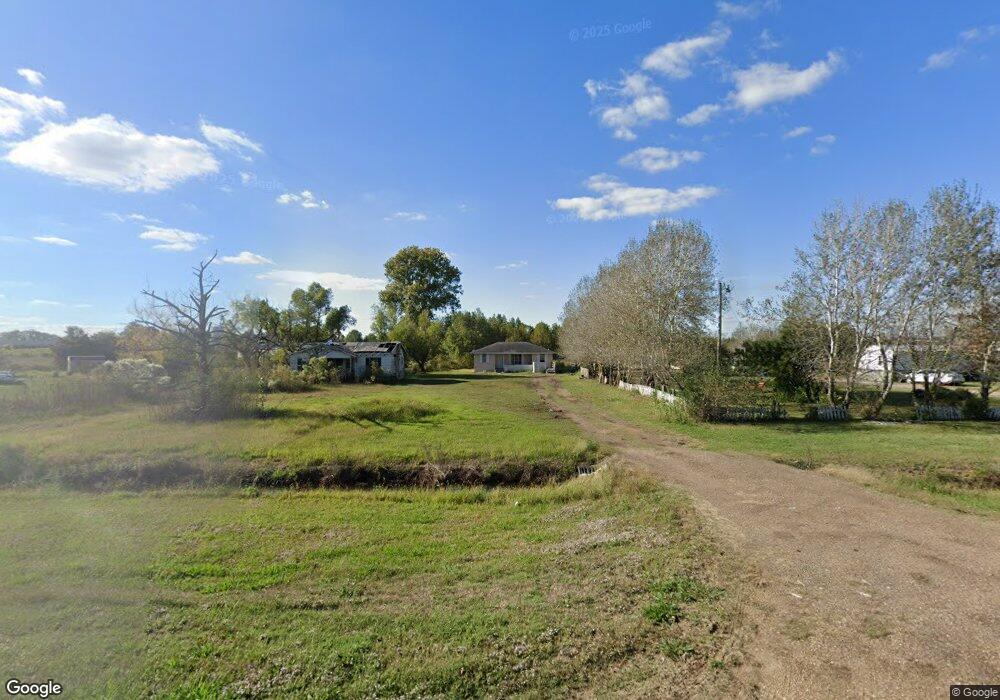
1123 Highway 3 Crenshaw, MS 38621
Estimated Value: $73,992 - $137,000
3
Beds
--
Bath
925
Sq Ft
$109/Sq Ft
Est. Value
About This Home
This home is located at 1123 Highway 3, Crenshaw, MS 38621 and is currently estimated at $100,748, approximately $108 per square foot. 1123 Highway 3 is a home with nearby schools including Crenshaw Elementary School, North Panola Junior High School, and North Panola High School.
Create a Home Valuation Report for This Property
The Home Valuation Report is an in-depth analysis detailing your home's value as well as a comparison with similar homes in the area
Home Values in the Area
Average Home Value in this Area
Tax History Compared to Growth
Tax History
| Year | Tax Paid | Tax Assessment Tax Assessment Total Assessment is a certain percentage of the fair market value that is determined by local assessors to be the total taxable value of land and additions on the property. | Land | Improvement |
|---|---|---|---|---|
| 2024 | $538 | $4,131 | $975 | $3,156 |
| 2023 | $538 | $4,131 | $975 | $3,156 |
| 2022 | $529 | $4,131 | $975 | $3,156 |
| 2021 | $533 | $4,131 | $975 | $3,156 |
| 2020 | $514 | $3,984 | $975 | $3,009 |
| 2019 | $498 | $3,984 | $975 | $3,009 |
| 2018 | $499 | $3,984 | $975 | $3,009 |
| 2017 | $499 | $3,984 | $975 | $3,009 |
| 2016 | -- | $2,473 | $525 | $1,948 |
| 2015 | -- | $2,473 | $525 | $1,948 |
| 2014 | -- | $2,473 | $525 | $1,948 |
| 2013 | -- | $1,694 | $525 | $1,169 |
Source: Public Records
Map
Nearby Homes
- 325 Oliver Ave
- 600 Quitman St
- Mississippi 315
- 215 South Ave
- 0 Indian Creek Rd Unit 23269860
- 0 Indian Creek Rd Unit 25-1759
- 0 Indian Creek Rd Unit 160634
- Indian Creek Rd
- 0 Avant Rd
- 5317 Highway 3
- 1640 Rowe Rd
- 1543 Curtis Rd
- 0 Brownsferry Rd Unit 4131343
- 0 Brownsferry Rd Unit 4130962
- 1761 Parks Place Rd
- 0 Magnolia Cir Unit 4117000
- 0 Magnolia Cir Unit 4117002
- 1326 Rowe Rd
- 2 Browns Ferry Rd
- 3443 Curtis Rd