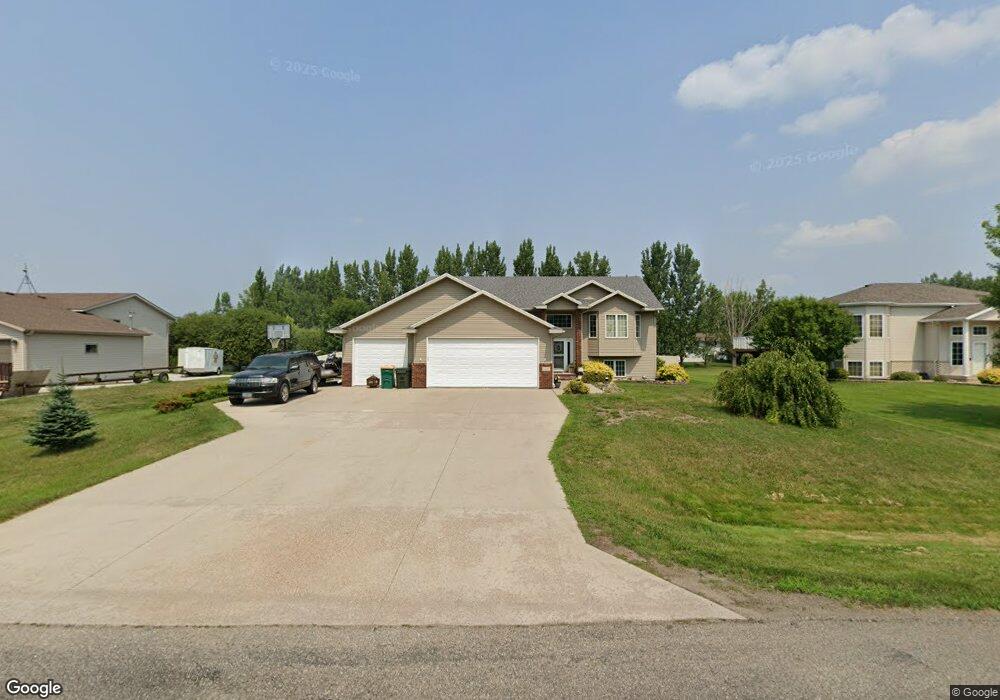
1123 Leonards Way Argusville, ND 58005
Estimated Value: $457,000 - $578,000
5
Beds
3
Baths
1,618
Sq Ft
$310/Sq Ft
Est. Value
About This Home
This home is located at 1123 Leonards Way, Argusville, ND 58005 and is currently estimated at $501,063, approximately $309 per square foot. 1123 Leonards Way is a home located in Cass County with nearby schools including Northern Cass Elementary School and Northern Cass High School.
Ownership History
Date
Name
Owned For
Owner Type
Purchase Details
Closed on
Apr 30, 2010
Sold by
Swanson Michael D and Swanson Rachelle M
Bought by
Strommen Mark A and Strommen Heather M
Current Estimated Value
Home Financials for this Owner
Home Financials are based on the most recent Mortgage that was taken out on this home.
Original Mortgage
$213,369
Outstanding Balance
$142,662
Interest Rate
5%
Mortgage Type
FHA
Estimated Equity
$358,401
Purchase Details
Closed on
Oct 3, 2006
Sold by
Verwest Contracting Inc
Bought by
Swanson Michael D and Swanson Rachelle M
Home Financials for this Owner
Home Financials are based on the most recent Mortgage that was taken out on this home.
Original Mortgage
$152,700
Interest Rate
6.58%
Mortgage Type
New Conventional
Purchase Details
Closed on
May 8, 2006
Sold by
Harr Brian N and Harr Stephanie R
Bought by
Verwest Contracting Inc
Create a Home Valuation Report for This Property
The Home Valuation Report is an in-depth analysis detailing your home's value as well as a comparison with similar homes in the area
Home Values in the Area
Average Home Value in this Area
Purchase History
| Date | Buyer | Sale Price | Title Company |
|---|---|---|---|
| Strommen Mark A | -- | -- | |
| Swanson Michael D | -- | -- | |
| Verwest Contracting Inc | -- | -- |
Source: Public Records
Mortgage History
| Date | Status | Borrower | Loan Amount |
|---|---|---|---|
| Open | Strommen Mark A | $213,369 | |
| Previous Owner | Swanson Michael D | $152,700 |
Source: Public Records
Tax History Compared to Growth
Tax History
| Year | Tax Paid | Tax Assessment Tax Assessment Total Assessment is a certain percentage of the fair market value that is determined by local assessors to be the total taxable value of land and additions on the property. | Land | Improvement |
|---|---|---|---|---|
| 2024 | $4,175 | $200,550 | $41,550 | $159,000 |
| 2023 | $4,790 | $187,500 | $32,650 | $154,850 |
| 2022 | $4,588 | $172,100 | $32,650 | $139,450 |
| 2021 | $4,269 | $160,100 | $32,650 | $127,450 |
| 2020 | $4,275 | $157,150 | $32,650 | $124,500 |
| 2019 | $4,335 | $157,150 | $32,650 | $124,500 |
| 2018 | $3,898 | $134,700 | $16,050 | $118,650 |
| 2017 | $3,676 | $128,300 | $15,300 | $113,000 |
| 2016 | $3,389 | $118,800 | $14,150 | $104,650 |
| 2015 | $3,260 | $118,800 | $14,150 | $104,650 |
| 2014 | $3,062 | $108,000 | $12,850 | $95,150 |
| 2013 | $934 | $98,200 | $11,700 | $86,500 |
Source: Public Records
Map
Nearby Homes
- 1115 Leonards Way
- 1131 Leonards Way
- 1107 Leonards Way
- 2531 167th Ave SE
- 2535 167th Ave SE
- 1124 Leonards Way
- 1132 Leonards Way
- 1116 Leonards Way
- 1033 Leonards Way
- 1108 Leonards Way
- 1025 Leonards Way
- 2539 167th Ave SE
- 1034 Leonards Way
- 1017 Leonards Way
- 1009 Leonards Way
- 609 Leonards Way
- 1018 Leonards Way
- 2551 167th Ave SE
- 1001 Leonards Way
- 1014 Leonards Way