Estimated Value: $2,647,000 - $3,599,000
6
Beds
5
Baths
3,997
Sq Ft
$770/Sq Ft
Est. Value
About This Home
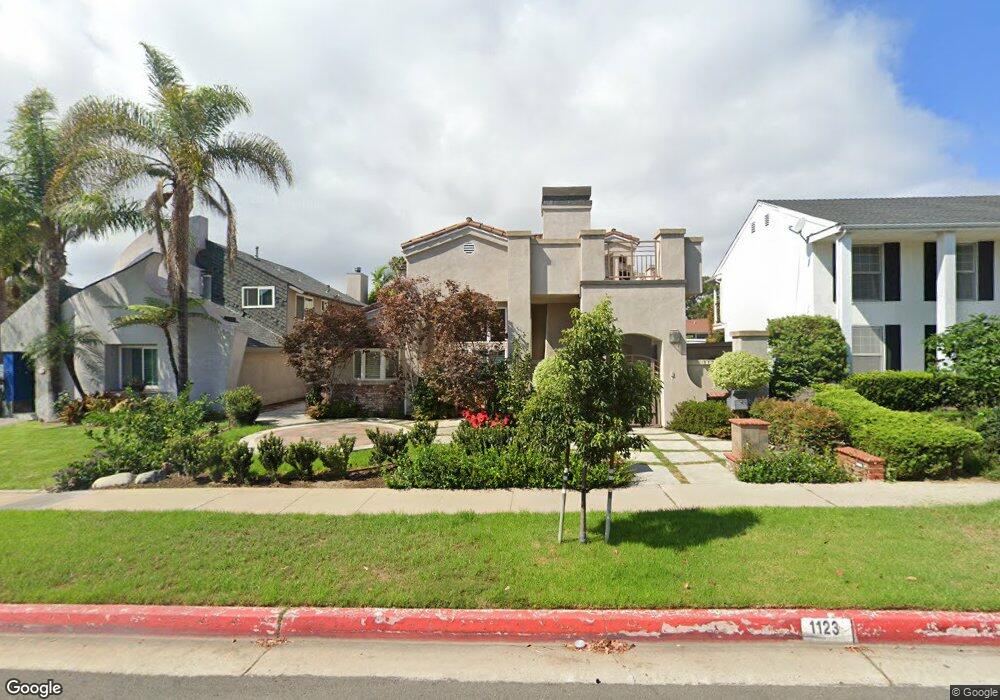
This home is located at 1123 Main St, Huntington Beach, CA 92648 and is currently estimated at $3,078,073, approximately $770 per square foot. 1123 Main St is a home located in Orange County with nearby schools including Agnes L. Smith Elementary, Ethel Dwyer Middle, and Huntington Beach High School.
Ownership History
Date
Name
Owned For
Owner Type
Purchase Details
Closed on
Mar 12, 2009
Sold by
Jp Morgan Chase Bank Na
Bought by
Huang John and Wu Jenny
Current Estimated Value
Home Financials for this Owner
Home Financials are based on the most recent Mortgage that was taken out on this home.
Original Mortgage
$525,000
Outstanding Balance
$334,183
Interest Rate
5.15%
Mortgage Type
Purchase Money Mortgage
Estimated Equity
$2,743,890
Purchase Details
Closed on
Dec 10, 2008
Sold by
Cross William M and Cross Hazel A
Bought by
Jpmorgan Chase Bank Na
Purchase Details
Closed on
Mar 11, 2003
Sold by
Vanherk Robert and Vanherk Julie
Bought by
Cross William M and Cross Hazel A
Home Financials for this Owner
Home Financials are based on the most recent Mortgage that was taken out on this home.
Original Mortgage
$806,250
Interest Rate
3.87%
Mortgage Type
Purchase Money Mortgage
Create a Home Valuation Report for This Property
The Home Valuation Report is an in-depth analysis detailing your home's value as well as a comparison with similar homes in the area
Home Values in the Area
Average Home Value in this Area
Purchase History
| Date | Buyer | Sale Price | Title Company |
|---|---|---|---|
| Huang John | $1,120,500 | Lawyers Title | |
| Jpmorgan Chase Bank Na | $1,220,656 | None Available | |
| Cross William M | $1,075,000 | Chicago Title Co |
Source: Public Records
Mortgage History
| Date | Status | Borrower | Loan Amount |
|---|---|---|---|
| Open | Huang John | $525,000 | |
| Previous Owner | Cross William M | $806,250 |
Source: Public Records
Tax History Compared to Growth
Tax History
| Year | Tax Paid | Tax Assessment Tax Assessment Total Assessment is a certain percentage of the fair market value that is determined by local assessors to be the total taxable value of land and additions on the property. | Land | Improvement |
|---|---|---|---|---|
| 2025 | $15,982 | $1,442,290 | $905,279 | $537,011 |
| 2024 | $15,982 | $1,414,010 | $887,528 | $526,482 |
| 2023 | $15,629 | $1,386,285 | $870,126 | $516,159 |
| 2022 | $15,222 | $1,359,103 | $853,064 | $506,039 |
| 2021 | $14,939 | $1,332,454 | $836,337 | $496,117 |
| 2020 | $14,843 | $1,318,792 | $827,762 | $491,030 |
| 2019 | $14,663 | $1,292,934 | $811,532 | $481,402 |
| 2018 | $14,437 | $1,267,583 | $795,620 | $471,963 |
| 2017 | $14,246 | $1,242,729 | $780,020 | $462,709 |
| 2016 | $13,604 | $1,218,362 | $764,725 | $453,637 |
| 2015 | $13,476 | $1,200,062 | $753,239 | $446,823 |
| 2014 | $13,196 | $1,176,555 | $738,484 | $438,071 |
Source: Public Records
Map
Nearby Homes