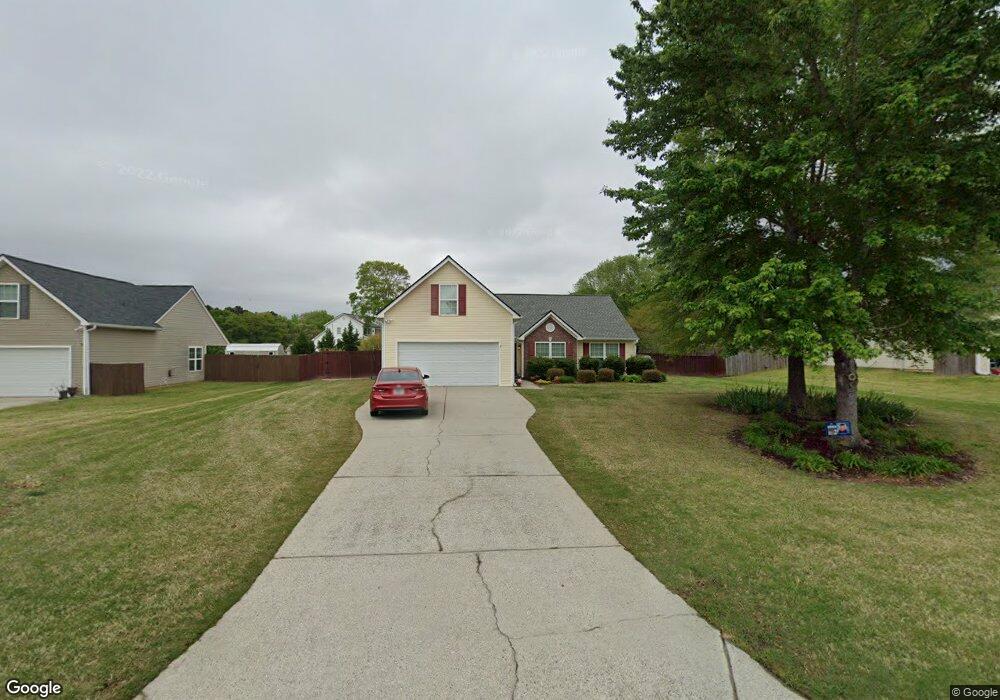
1123 Otis Dr Bethlehem, GA 30620
Estimated Value: $329,000 - $361,000
--
Bed
2
Baths
1,842
Sq Ft
$188/Sq Ft
Est. Value
About This Home
This home is located at 1123 Otis Dr, Bethlehem, GA 30620 and is currently estimated at $346,725, approximately $188 per square foot. 1123 Otis Dr is a home located in Barrow County with nearby schools including Yargo Elementary School, Haymon-Morris Middle School, and Apalachee High School.
Ownership History
Date
Name
Owned For
Owner Type
Purchase Details
Closed on
Aug 18, 2022
Sold by
Horton Lauren L
Bought by
Horton Laura L
Current Estimated Value
Home Financials for this Owner
Home Financials are based on the most recent Mortgage that was taken out on this home.
Original Mortgage
$50,000
Outstanding Balance
$37,411
Interest Rate
5.54%
Mortgage Type
New Conventional
Estimated Equity
$309,314
Purchase Details
Closed on
May 5, 2006
Sold by
Crown Pk Hms Of Cambridge Llc
Bought by
Williams Laura H and Williams Aaron B
Home Financials for this Owner
Home Financials are based on the most recent Mortgage that was taken out on this home.
Original Mortgage
$123,100
Interest Rate
6.28%
Mortgage Type
New Conventional
Purchase Details
Closed on
Jun 11, 2004
Sold by
Millstone Development Group In
Bought by
Crown Park Homes At Cambridge Llc
Purchase Details
Closed on
Apr 1, 2004
Bought by
Millstone Development Group Inc
Create a Home Valuation Report for This Property
The Home Valuation Report is an in-depth analysis detailing your home's value as well as a comparison with similar homes in the area
Home Values in the Area
Average Home Value in this Area
Purchase History
| Date | Buyer | Sale Price | Title Company |
|---|---|---|---|
| Horton Laura L | -- | -- | |
| Williams Laura H | $153,900 | -- | |
| Crown Park Homes At Cambridge Llc | $38,500 | -- | |
| Millstone Development Group Inc | -- | -- |
Source: Public Records
Mortgage History
| Date | Status | Borrower | Loan Amount |
|---|---|---|---|
| Open | Horton Laura L | $50,000 | |
| Previous Owner | Williams Laura H | $123,100 |
Source: Public Records
Tax History Compared to Growth
Tax History
| Year | Tax Paid | Tax Assessment Tax Assessment Total Assessment is a certain percentage of the fair market value that is determined by local assessors to be the total taxable value of land and additions on the property. | Land | Improvement |
|---|---|---|---|---|
| 2024 | $3,215 | $130,665 | $28,000 | $102,665 |
| 2023 | $2,625 | $123,490 | $28,000 | $95,490 |
| 2022 | $2,552 | $86,519 | $22,400 | $64,119 |
| 2021 | $2,238 | $71,202 | $18,000 | $53,202 |
| 2020 | $2,112 | $66,835 | $18,000 | $48,835 |
| 2019 | $2,149 | $66,835 | $18,000 | $48,835 |
| 2018 | $2,011 | $63,035 | $14,200 | $48,835 |
| 2017 | $1,569 | $53,887 | $14,200 | $39,687 |
| 2016 | $1,522 | $47,436 | $14,200 | $33,236 |
| 2015 | $1,408 | $47,792 | $14,200 | $33,592 |
| 2014 | $1,237 | $41,789 | $7,840 | $33,949 |
| 2013 | -- | $39,650 | $7,840 | $31,810 |
Source: Public Records
Map
Nearby Homes
- 1111 Otis Dr
- 1024 Lyndhurst Ln
- 1129 Loganville Hwy
- 209 Angie Way
- 1164 Otis Dr
- 303 Ron Dr
- 738 Worth Ct
- 704 Newnham Walk
- 724 Westbury Dr
- 720 Westbury Ct
- 713 Carl Bethlehem Rd
- 934 Beaver Hill Dr
- 758 Clarence Edwards Rd
- 73 Silverleaf Trail
- 64 Silverleaf Trail
- 0 Jb Owens Unit 7552902
- 0 Jb Owens Unit 7552891
- 0 Jb Owens Unit LOT 2 - 2.09 ACRES
- 0 Jb Owens Unit LOT 3 - 2.01 ACRES
- 268 Silverleaf Trail