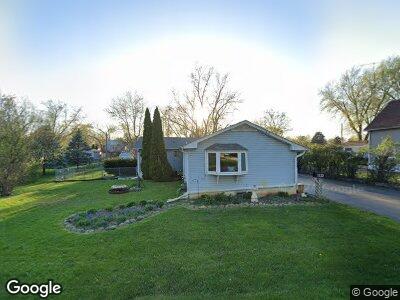
1123 S Union St Aurora, IL 60505
Southeast Aurora NeighborhoodEstimated Value: $225,000 - $306,000
4
Beds
2
Baths
1,712
Sq Ft
$155/Sq Ft
Est. Value
About This Home
This home is located at 1123 S Union St, Aurora, IL 60505 and is currently estimated at $265,211, approximately $154 per square foot. 1123 S Union St is a home located in Kane County with nearby schools including Dieterich Elementary School, K D Waldo Middle School, and East Aurora High School.
Ownership History
Date
Name
Owned For
Owner Type
Purchase Details
Closed on
Dec 27, 2022
Sold by
Simpkins Timothy J and Simpkins Mary Grace
Bought by
Timothy J Simpkins Trust and Mary G Simpkins Trust
Current Estimated Value
Purchase Details
Closed on
Jun 5, 2015
Sold by
Simpkins Timothy J and Simpkins Mary Grace
Bought by
Simpkins Timothy J and Simpkins Mary Grace
Home Financials for this Owner
Home Financials are based on the most recent Mortgage that was taken out on this home.
Original Mortgage
$84,000
Interest Rate
4.12%
Mortgage Type
New Conventional
Purchase Details
Closed on
Aug 5, 2011
Sold by
Simpkins Timothy J and Simpkins Mary Grace
Bought by
Simpkins Timothy J and Simpkins Mary Grace
Purchase Details
Closed on
Mar 28, 2000
Sold by
Layman Ralph E and Layman Ralph E
Bought by
Simpkins Timothy J and Simpkins Mary G
Home Financials for this Owner
Home Financials are based on the most recent Mortgage that was taken out on this home.
Original Mortgage
$81,500
Interest Rate
8.31%
Create a Home Valuation Report for This Property
The Home Valuation Report is an in-depth analysis detailing your home's value as well as a comparison with similar homes in the area
Home Values in the Area
Average Home Value in this Area
Purchase History
| Date | Buyer | Sale Price | Title Company |
|---|---|---|---|
| Timothy J Simpkins Trust | -- | -- | |
| Simpkins Timothy J | -- | Barrister Title | |
| Simpkins Timothy J | -- | None Available | |
| Simpkins Timothy J | $90,000 | Law Title Insurance Co Inc |
Source: Public Records
Mortgage History
| Date | Status | Borrower | Loan Amount |
|---|---|---|---|
| Previous Owner | Simpkins Timothy J | $105,600 | |
| Previous Owner | Simpkins Timothy J | $84,000 | |
| Previous Owner | Simpkins Mary G | $75,000 | |
| Previous Owner | Simpkins Timothy J | $98,000 | |
| Previous Owner | Simpkins Timothy J | $39,500 | |
| Previous Owner | Simpkins Timothy J | $89,000 | |
| Previous Owner | Simpkins Timothy J | $80,000 | |
| Previous Owner | Simpkins Timothy J | $10,000 | |
| Previous Owner | Simpkins Timothy J | $81,500 |
Source: Public Records
Tax History Compared to Growth
Tax History
| Year | Tax Paid | Tax Assessment Tax Assessment Total Assessment is a certain percentage of the fair market value that is determined by local assessors to be the total taxable value of land and additions on the property. | Land | Improvement |
|---|---|---|---|---|
| 2023 | $3,985 | $74,817 | $14,467 | $60,350 |
| 2022 | $3,510 | $64,342 | $13,200 | $51,142 |
| 2021 | $3,466 | $59,903 | $12,289 | $47,614 |
| 2020 | $3,299 | $55,641 | $11,415 | $44,226 |
| 2019 | $3,241 | $51,553 | $10,576 | $40,977 |
| 2018 | $3,270 | $49,744 | $9,783 | $39,961 |
| 2017 | $3,033 | $43,124 | $9,014 | $34,110 |
| 2016 | $2,850 | $38,056 | $9,090 | $28,966 |
| 2015 | -- | $33,741 | $7,817 | $25,924 |
| 2014 | -- | $33,250 | $7,184 | $26,066 |
| 2013 | -- | $27,486 | $7,628 | $19,858 |
Source: Public Records
Map
Nearby Homes
- 1028 5th St
- 1368 Talma St
- 629 S Union St
- 633 Watson St
- 1228 Lebanon St
- 1210 Douglas Ave
- Lot 1 Douglas Ave
- 454 Weston Ave
- 620 Lebanon St
- 735 Sexton St
- 916 5th Ave
- 995 Celebration Dr
- 991 Celebration Dr
- 312 S Spencer St
- 408 S East Ave
- 983 Celebration Dr
- 555 North Ave
- 450 Center Ave
- 307 Bevier Place
- 950 Harriet Ave
- 1123 S Union St
- 1129 S Union St
- 1127 S Union St
- 1145 S Union St
- 1120 Bangs St
- 1128 Bangs St
- 1118 Bangs St
- 1138 Bangs St
- 1121 S Union St
- 1116 Bangs St
- 1147 S Union St
- 1126 S Union St
- 1122 S Union St
- 1118 S Union St
- 1114 Bangs St
- 1117 S Union St
- 1146 Bangs St
- 1155 S Union St
- 1146 S Union St
- 1112 Bangs St