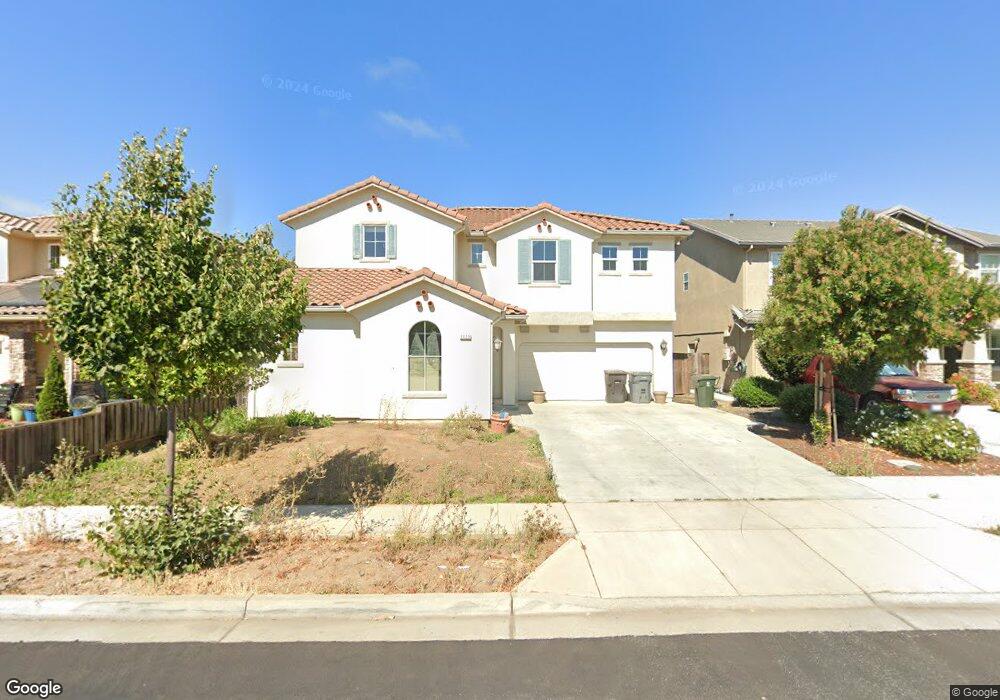
1123 Siena Way Salinas, CA 93905
East Salinas NeighborhoodEstimated Value: $847,424 - $935,000
--
Bed
4
Baths
2,664
Sq Ft
$336/Sq Ft
Est. Value
About This Home
This home is located at 1123 Siena Way, Salinas, CA 93905 and is currently estimated at $894,606, approximately $335 per square foot. 1123 Siena Way is a home with nearby schools including Monte Bella Elementary School, El Sausal Middle School, and Alisal High School.
Ownership History
Date
Name
Owned For
Owner Type
Purchase Details
Closed on
Aug 26, 2015
Sold by
Jeremiad Property Llc
Bought by
Marquez Stella P
Current Estimated Value
Home Financials for this Owner
Home Financials are based on the most recent Mortgage that was taken out on this home.
Original Mortgage
$544,100
Outstanding Balance
$427,355
Interest Rate
3.91%
Mortgage Type
VA
Estimated Equity
$467,251
Purchase Details
Closed on
May 21, 2010
Sold by
Vch Salinas Ii Inc
Bought by
Vch Salinas Iii Llc
Create a Home Valuation Report for This Property
The Home Valuation Report is an in-depth analysis detailing your home's value as well as a comparison with similar homes in the area
Home Values in the Area
Average Home Value in this Area
Purchase History
| Date | Buyer | Sale Price | Title Company |
|---|---|---|---|
| Marquez Stella P | $558,000 | Amity Title Company | |
| Vch Salinas Iii Llc | $3,738,000 | Old Republic Title Company |
Source: Public Records
Mortgage History
| Date | Status | Borrower | Loan Amount |
|---|---|---|---|
| Open | Marquez Stella P | $544,100 |
Source: Public Records
Tax History
| Year | Tax Paid | Tax Assessment Tax Assessment Total Assessment is a certain percentage of the fair market value that is determined by local assessors to be the total taxable value of land and additions on the property. | Land | Improvement |
|---|---|---|---|---|
| 2025 | $7,871 | $670,563 | $180,271 | $490,292 |
| 2024 | $7,871 | $657,416 | $176,737 | $480,679 |
| 2023 | $7,272 | $644,526 | $173,272 | $471,254 |
| 2022 | $6,700 | $631,889 | $169,875 | $462,014 |
| 2021 | $6,927 | $619,500 | $166,545 | $452,955 |
| 2020 | $6,667 | $613,149 | $164,838 | $448,311 |
| 2019 | $6,871 | $601,127 | $161,606 | $439,521 |
| 2018 | $6,549 | $589,341 | $158,438 | $430,903 |
| 2017 | $6,786 | $577,786 | $155,332 | $422,454 |
| 2016 | $6,488 | $566,458 | $152,287 | $414,171 |
| 2015 | $3,819 | $429,000 | $80,000 | $349,000 |
| 2014 | $1,711 | $70,317 | $70,317 | $0 |
Source: Public Records
Map
Nearby Homes
- 1215 Campania Way
- 230 Paloma Ave
- 1046 C St
- 933 Acosta Plaza Unit 35
- 948 Rider Ave
- 755 Pino Way
- 1544 Saguaro Dr Unit 4
- 11 Hill Cir
- 11 E Laurel Dr
- 11 Fresa Place
- 11 Saguaro Cir
- 320 N Sanborn Rd
- 755 La Guardia St
- 743 La Guardia St
- 609 Saint George Dr
- 544 Saint George Dr
- 1094 Twin Creeks Dr
- 129 N Filice St
- 1049 Twin Creeks Dr
- 724 Circle Dr
Your Personal Tour Guide
Ask me questions while you tour the home.