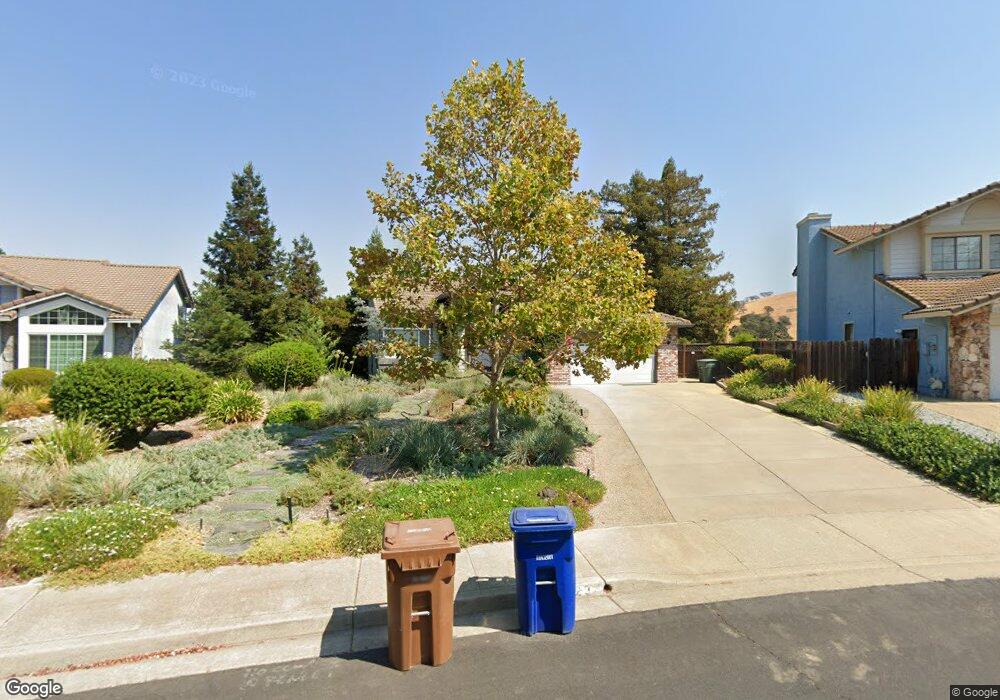
1123 Vista Point Ln Concord, CA 94521
The Highlands NeighborhoodEstimated Value: $1,090,000 - $1,326,000
4
Beds
3
Baths
2,159
Sq Ft
$554/Sq Ft
Est. Value
About This Home
This home is located at 1123 Vista Point Ln, Concord, CA 94521 and is currently estimated at $1,195,729, approximately $553 per square foot. 1123 Vista Point Ln is a home located in Contra Costa County with nearby schools including Highlands Elementary School, Mt. Diablo Elementary School, and Pine Hollow Middle School.
Ownership History
Date
Name
Owned For
Owner Type
Purchase Details
Closed on
Jun 13, 2018
Sold by
Sims Lanny Wiono and Sims Amanda M
Bought by
Manning Ronald and Manning Lisa
Current Estimated Value
Home Financials for this Owner
Home Financials are based on the most recent Mortgage that was taken out on this home.
Original Mortgage
$664,000
Outstanding Balance
$575,534
Interest Rate
4.6%
Mortgage Type
New Conventional
Estimated Equity
$620,195
Purchase Details
Closed on
Jan 20, 2018
Sold by
Sims Lanny W and Sims Amanda M
Bought by
Sims Lanny W and Sims Amanda M
Purchase Details
Closed on
Mar 24, 2011
Sold by
Sims Jimmy W and Sims Lanny W
Bought by
Sims Jimmy William and Sims Lanny Wiono
Purchase Details
Closed on
Dec 12, 1997
Sold by
Montero James W and Montero Shirley A
Bought by
Sims Jimmy W and Sims Lanny W
Home Financials for this Owner
Home Financials are based on the most recent Mortgage that was taken out on this home.
Original Mortgage
$270,400
Interest Rate
7.23%
Mortgage Type
Purchase Money Mortgage
Create a Home Valuation Report for This Property
The Home Valuation Report is an in-depth analysis detailing your home's value as well as a comparison with similar homes in the area
Home Values in the Area
Average Home Value in this Area
Purchase History
| Date | Buyer | Sale Price | Title Company |
|---|---|---|---|
| Manning Ronald | $835,000 | Chicago Title Company | |
| Sims Lanny W | -- | None Available | |
| Sims Jimmy William | -- | None Available | |
| Sims Jimmy W | $338,000 | Old Republic Title Company |
Source: Public Records
Mortgage History
| Date | Status | Borrower | Loan Amount |
|---|---|---|---|
| Open | Manning Ronald | $664,000 | |
| Previous Owner | Sims Jimmy W | $270,400 |
Source: Public Records
Tax History
| Year | Tax Paid | Tax Assessment Tax Assessment Total Assessment is a certain percentage of the fair market value that is determined by local assessors to be the total taxable value of land and additions on the property. | Land | Improvement |
|---|---|---|---|---|
| 2025 | $11,499 | $931,451 | $652,575 | $278,876 |
| 2024 | $11,029 | $913,188 | $639,780 | $273,408 |
| 2023 | $11,029 | $895,284 | $627,236 | $268,048 |
| 2022 | $10,900 | $877,731 | $614,938 | $262,793 |
| 2021 | $10,650 | $860,522 | $602,881 | $257,641 |
| 2019 | $10,462 | $835,000 | $585,000 | $250,000 |
| 2018 | $6,162 | $474,311 | $164,183 | $310,128 |
| 2017 | $5,960 | $465,012 | $160,964 | $304,048 |
| 2016 | $5,797 | $455,895 | $157,808 | $298,087 |
| 2015 | $5,729 | $449,048 | $155,438 | $293,610 |
| 2014 | $5,629 | $440,253 | $152,394 | $287,859 |
Source: Public Records
Map
Nearby Homes
- 1109 Vista Point Ln
- 5350 Fernbank Dr Unit 1
- 1271 Kentucky Dr
- 5391 Fernbank Dr
- 1297 Kansas Cir
- 5535 Merritt Dr
- 868 Deer Spring Cir
- 995 Rosehedge Ct
- 5434 Roundtree Ct Unit A
- 5468 Roundtree Dr Unit C
- 5408 Oakstone Ct
- 1120 Kenwal Rd Unit C
- 5492 Roundtree Dr Unit A
- 1195 Kenwal Rd Unit B
- 5506 Nebraska Dr
- 974 Rosehedge Ct
- 5451 Roundtree Place
- 1346 Montana Dr
- 1395 Kenwal Rd Unit A
- 5092 Black Oak Rd
- 1125 Vista Point Ln
- 1121 Vista Point Ln
- 1119 Vista Point Ln
- 1126 Vista Point Ln
- 1118 Vista Point Ln
- 5334 Vista Point Ct
- 1117 Vista Point Ln
- 5332 Vista Point Ct
- 1115 Vista Point Ln
- 5331 Vista Point Ct
- 5418 Paso Del Rio Ct
- 5416 Paso Del Rio Ct
- 5330 Vista Point Ct
- 5419 Paso Del Rio Ct
- 1113 Vista Point Ln
- 1114 Vista Point Ln
- 5414 Paso Del Rio Ct
- 5417 Paso Del Rio Ct
- 1111 Vista Point Ln
- 5325 Vista Point Ct
Your Personal Tour Guide
Ask me questions while you tour the home.