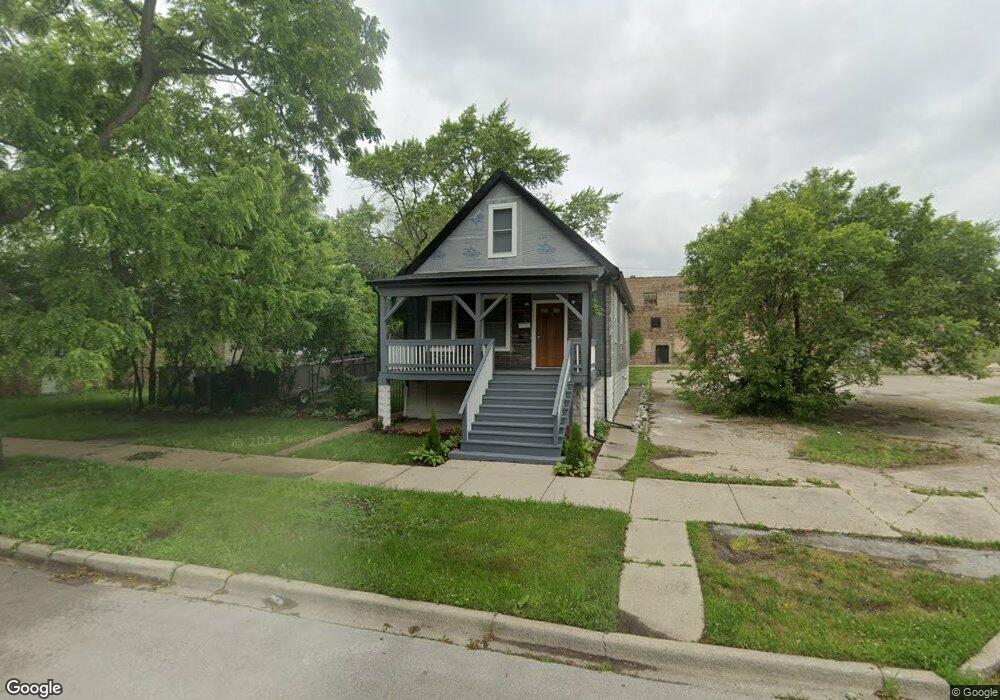
11234 S Edbrooke Ave Chicago, IL 60628
Roseland NeighborhoodEstimated Value: $95,000 - $222,000
3
Beds
2
Baths
1,056
Sq Ft
$147/Sq Ft
Est. Value
About This Home
This home is located at 11234 S Edbrooke Ave, Chicago, IL 60628 and is currently estimated at $155,464, approximately $147 per square foot. 11234 S Edbrooke Ave is a home located in Cook County with nearby schools including Curtis Elementary School, Corliss High School, and CICS Prairie.
Ownership History
Date
Name
Owned For
Owner Type
Purchase Details
Closed on
Oct 20, 2023
Sold by
Illinois Land Investment Inc
Bought by
Roque Jorge Nieto and Rivera Esther Vargas
Current Estimated Value
Purchase Details
Closed on
Sep 18, 2023
Sold by
Harris Onnia
Bought by
Illinois Land Investment Inc
Purchase Details
Closed on
Apr 16, 2018
Sold by
Harris Theophilus
Bought by
Harris Onnig
Purchase Details
Closed on
May 11, 2011
Sold by
Federal Home Loan Mortgage Corporation
Bought by
Harris Theophilus
Purchase Details
Closed on
Apr 12, 2011
Sold by
Creighton Shawn
Bought by
Federal Home Loan Mortgage Corp
Purchase Details
Closed on
Dec 18, 2007
Sold by
Zech Rodney
Bought by
Crighton Shawn
Home Financials for this Owner
Home Financials are based on the most recent Mortgage that was taken out on this home.
Original Mortgage
$135,000
Interest Rate
6.22%
Mortgage Type
Purchase Money Mortgage
Create a Home Valuation Report for This Property
The Home Valuation Report is an in-depth analysis detailing your home's value as well as a comparison with similar homes in the area
Home Values in the Area
Average Home Value in this Area
Purchase History
| Date | Buyer | Sale Price | Title Company |
|---|---|---|---|
| Roque Jorge Nieto | -- | None Listed On Document | |
| Illinois Land Investment Inc | $30,000 | None Listed On Document | |
| Harris Onnig | -- | None Available | |
| Harris Theophilus | $6,000 | First American | |
| Federal Home Loan Mortgage Corp | -- | None Available | |
| Crighton Shawn | $135,000 | Chicago Title Insurance Co |
Source: Public Records
Mortgage History
| Date | Status | Borrower | Loan Amount |
|---|---|---|---|
| Previous Owner | Crighton Shawn | $135,000 |
Source: Public Records
Tax History Compared to Growth
Tax History
| Year | Tax Paid | Tax Assessment Tax Assessment Total Assessment is a certain percentage of the fair market value that is determined by local assessors to be the total taxable value of land and additions on the property. | Land | Improvement |
|---|---|---|---|---|
| 2024 | $1,000 | $6,060 | $2,495 | $3,565 |
| 2023 | $956 | $7,713 | $3,950 | $3,763 |
| 2022 | $956 | $7,713 | $3,950 | $3,763 |
| 2021 | $951 | $7,712 | $3,950 | $3,762 |
| 2020 | $1,100 | $7,718 | $2,702 | $5,016 |
| 2019 | $1,120 | $8,647 | $2,702 | $5,945 |
| 2018 | $1,100 | $8,647 | $2,702 | $5,945 |
| 2017 | $1,062 | $7,959 | $2,494 | $5,465 |
| 2016 | $1,147 | $7,959 | $2,494 | $5,465 |
| 2015 | $1,028 | $7,959 | $2,494 | $5,465 |
| 2014 | $914 | $7,227 | $2,079 | $5,148 |
| 2013 | $886 | $7,227 | $2,079 | $5,148 |
Source: Public Records
Map
Nearby Homes
- 11241 S Michigan Ave
- 11317 S Edbrooke Ave
- 26 E 113th St
- 1 W 112th Place
- 6 W 111th Place
- 118 W 113th Place
- 1 E 114th St
- 26 W 114th St
- 11419 S Prairie Ave
- 62 W 113th St
- 12551-53 S State St
- 11365 S Forest Ave
- 11000 S Michigan Ave
- 153 E 110th St
- 124 E 110th St
- 106 W 114th St
- 120 E Kensington Ave
- 11230 S Vernon Ave
- 11437 S Calumet Ave
- 11418 S King Dr
- 11234 S Edbrooke Ave
- 11238 S Edbrooke Ave
- 11242 S Edbrooke Ave
- 11244 S Edbrooke Ave
- 11246 S Edbrooke Ave
- 11250 S Edbrooke Ave
- 11235 S Edbrooke Ave
- 11233 S Michigan Ave
- 11221 S Michigan Ave
- 11221-27 S Michigan Ave
- 11252 S Edbrooke Ave
- 11229 S Edbrooke Ave
- 11237 S Edbrooke Ave
- 11237 S Edbrooke Ave
- 11223 S Edbrooke Ave
- 11239 S Edbrooke Ave
- 11217 S Michigan Ave
- 11243 S Edbrooke Ave
- 11243 S Edbrooke Ave
- 11213 S Edbrooke Ave