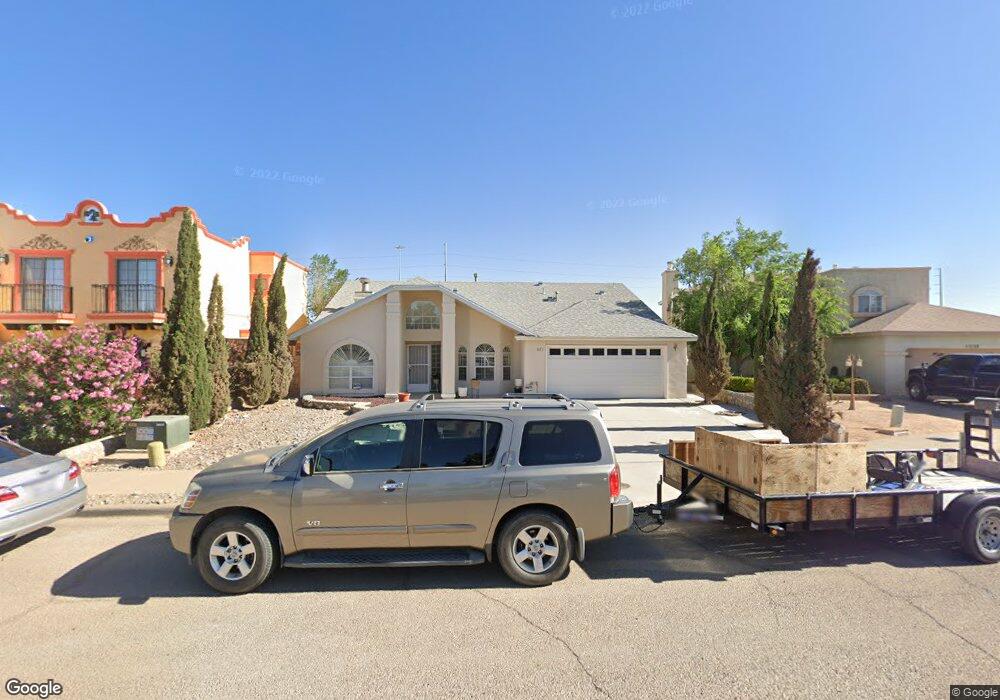
11235 Tekoa Ct El Paso, TX 79936
Indian Ridge NeighborhoodEstimated Value: $293,917 - $324,000
4
Beds
3
Baths
2,322
Sq Ft
$132/Sq Ft
Est. Value
About This Home
This home is located at 11235 Tekoa Ct, El Paso, TX 79936 and is currently estimated at $305,979, approximately $131 per square foot. 11235 Tekoa Ct is a home located in El Paso County with nearby schools including Pebble Hills Elementary School, J.M. Hanks Middle School, and J M Hanks High School.
Ownership History
Date
Name
Owned For
Owner Type
Purchase Details
Closed on
Nov 28, 2005
Sold by
Ncj Development Inc
Bought by
Soto Reynaldo and Soto Esperanza
Current Estimated Value
Home Financials for this Owner
Home Financials are based on the most recent Mortgage that was taken out on this home.
Original Mortgage
$152,500
Outstanding Balance
$84,053
Interest Rate
6.04%
Mortgage Type
VA
Estimated Equity
$221,926
Purchase Details
Closed on
Sep 30, 2005
Sold by
Madrid Carlos J
Bought by
Ncj Development Inc
Home Financials for this Owner
Home Financials are based on the most recent Mortgage that was taken out on this home.
Original Mortgage
$152,500
Outstanding Balance
$84,053
Interest Rate
6.04%
Mortgage Type
VA
Estimated Equity
$221,926
Purchase Details
Closed on
Nov 27, 2000
Sold by
Salas Ray and Salas Maria
Bought by
Madrid Carlos J
Home Financials for this Owner
Home Financials are based on the most recent Mortgage that was taken out on this home.
Original Mortgage
$112,575
Interest Rate
7.82%
Create a Home Valuation Report for This Property
The Home Valuation Report is an in-depth analysis detailing your home's value as well as a comparison with similar homes in the area
Home Values in the Area
Average Home Value in this Area
Purchase History
| Date | Buyer | Sale Price | Title Company |
|---|---|---|---|
| Soto Reynaldo | -- | -- | |
| Ncj Development Inc | -- | -- | |
| Madrid Carlos J | -- | -- |
Source: Public Records
Mortgage History
| Date | Status | Borrower | Loan Amount |
|---|---|---|---|
| Open | Soto Reynaldo | $152,500 | |
| Previous Owner | Madrid Carlos J | $112,575 |
Source: Public Records
Tax History Compared to Growth
Tax History
| Year | Tax Paid | Tax Assessment Tax Assessment Total Assessment is a certain percentage of the fair market value that is determined by local assessors to be the total taxable value of land and additions on the property. | Land | Improvement |
|---|---|---|---|---|
| 2025 | -- | $296,555 | -- | -- |
| 2024 | -- | $269,595 | -- | -- |
| 2023 | $7,133 | $245,086 | $0 | $0 |
| 2022 | $6,919 | $222,805 | $0 | $0 |
| 2021 | $6,584 | $202,550 | $25,564 | $176,986 |
| 2020 | $5,831 | $184,603 | $19,903 | $164,700 |
| 2018 | $5,551 | $178,509 | $19,903 | $158,606 |
| 2017 | $5,289 | $173,038 | $19,903 | $153,135 |
| 2016 | $5,289 | $173,038 | $19,903 | $153,135 |
| 2015 | -- | $173,038 | $19,903 | $153,135 |
| 2014 | -- | $171,811 | $19,903 | $151,908 |
Source: Public Records
Map
Nearby Homes
- 3651 George Dieter Dr
- 11254 Montana Ave
- 11189 Childress Ave
- 11298 Montana Ave
- 11165 Shiner Ave
- 11272 Ivanhoe Dr
- 11273 Ivanhoe Dr
- 11549 MacAw Palm Dr
- 11025 Sunshine Ct
- 3352 Broken Bow St
- 11016 Aqua Ct
- 3428 Itasca St
- 11334 Jasso Ct
- 11338 Jasso
- 11337 Ardelle Ave
- 11342 Jasso
- 11346 Jasso Ct
- 11312 Ardelle Ave
- 3332 Mclean St
- 3309 Broken Bow St
- 11231 Tekoa Ct
- 11239 Tekoa Ct
- 11243 Tekoa Ct
- 11320 Tekoa Ct
- 11234 Tekoa Ct
- 11230 Tekoa Ct
- 11246 Tekoa Ct
- 11236 Montana Ave
- 11220 Montana Ave
- 11238 Tekoa Ct
- 3642 Red Cloud Place
- 3638 Red Cloud Place
- 11242 Tekoa Ct
- 11231 Kachina Dr
- 11235 Kachina Dr
- 3634 Red Cloud Place
- 11239 Kachina Dr
- 11243 Kachina Dr
- 3630 Red Cloud Place
- 3643 Red Cloud Place