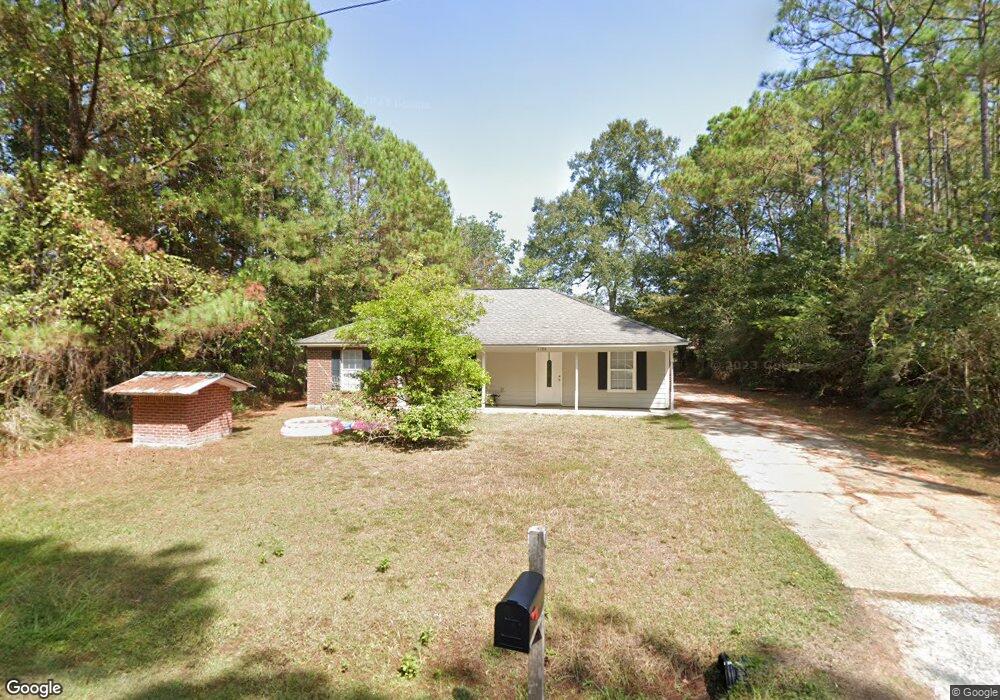
1124 Ash St Ocean Springs, MS 39564
Estimated Value: $171,251 - $189,000
3
Beds
2
Baths
1,275
Sq Ft
$143/Sq Ft
Est. Value
About This Home
This home is located at 1124 Ash St, Ocean Springs, MS 39564 and is currently estimated at $182,313, approximately $142 per square foot. 1124 Ash St is a home located in Jackson County with nearby schools including Pecan Park Elementary School, Ocean Springs Middle School, and Ocean Springs High School.
Ownership History
Date
Name
Owned For
Owner Type
Purchase Details
Closed on
Aug 27, 2024
Sold by
Gulf Coast Residential Properties Llc
Bought by
70 Properties Llc
Current Estimated Value
Home Financials for this Owner
Home Financials are based on the most recent Mortgage that was taken out on this home.
Original Mortgage
$5,700,000
Interest Rate
6.32%
Mortgage Type
New Conventional
Purchase Details
Closed on
Jul 16, 2010
Sold by
Secretary Of Housing And Urban Developme
Bought by
Gulf Coast Residential Properties Llc
Create a Home Valuation Report for This Property
The Home Valuation Report is an in-depth analysis detailing your home's value as well as a comparison with similar homes in the area
Home Values in the Area
Average Home Value in this Area
Purchase History
| Date | Buyer | Sale Price | Title Company |
|---|---|---|---|
| 70 Properties Llc | -- | Coast Title | |
| 70 Properties Llc | -- | Coast Title | |
| 70 Properties Llc | -- | Coast Title | |
| Gulf Coast Residential Properties Llc | -- | Luckett Land Title Inc |
Source: Public Records
Mortgage History
| Date | Status | Borrower | Loan Amount |
|---|---|---|---|
| Previous Owner | 70 Properties Llc | $5,700,000 |
Source: Public Records
Tax History Compared to Growth
Tax History
| Year | Tax Paid | Tax Assessment Tax Assessment Total Assessment is a certain percentage of the fair market value that is determined by local assessors to be the total taxable value of land and additions on the property. | Land | Improvement |
|---|---|---|---|---|
| 2024 | $1,593 | $12,363 | $705 | $11,658 |
| 2023 | $1,593 | $12,363 | $705 | $11,658 |
| 2022 | $1,592 | $12,363 | $705 | $11,658 |
| 2021 | $1,605 | $12,471 | $705 | $11,766 |
| 2020 | $1,453 | $11,165 | $642 | $10,523 |
| 2019 | $1,424 | $11,165 | $642 | $10,523 |
| 2018 | $1,428 | $11,165 | $642 | $10,523 |
| 2017 | $1,428 | $11,165 | $642 | $10,523 |
| 2016 | $1,428 | $11,165 | $642 | $10,523 |
| 2015 | $1,138 | $58,060 | $3,710 | $54,350 |
| 2014 | $1,188 | $9,097 | $557 | $8,540 |
| 2013 | $1,158 | $9,097 | $557 | $8,540 |
Source: Public Records
Map
Nearby Homes