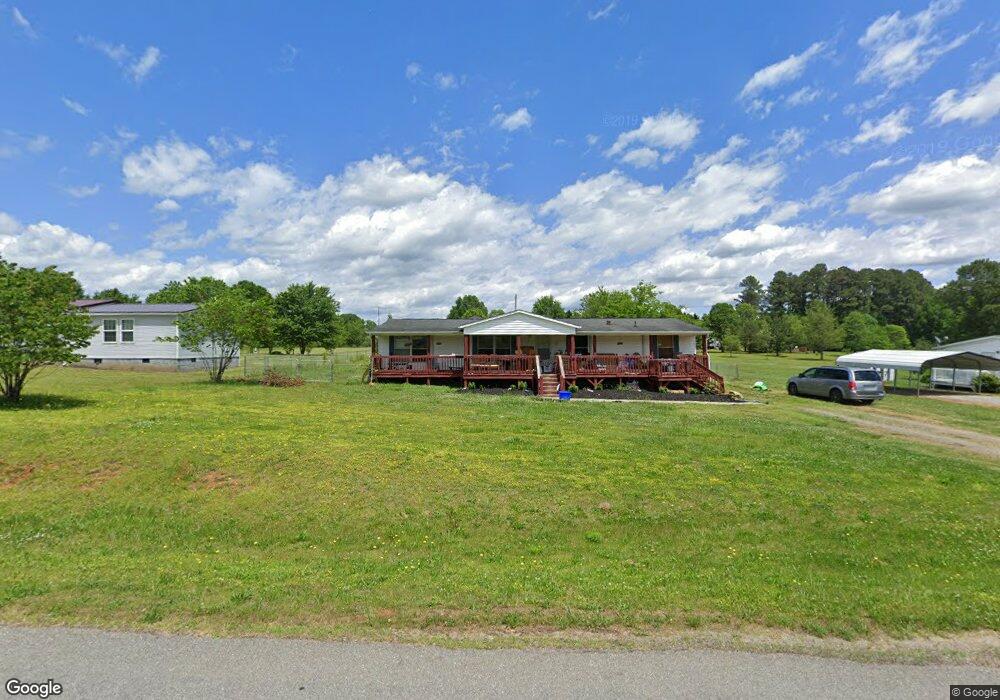
1124 Highland Bluff Ct Lincolnton, NC 28092
Estimated Value: $234,000 - $266,000
4
Beds
2
Baths
1,792
Sq Ft
$137/Sq Ft
Est. Value
About This Home
This home is located at 1124 Highland Bluff Ct, Lincolnton, NC 28092 and is currently estimated at $246,333, approximately $137 per square foot. 1124 Highland Bluff Ct is a home located in Lincoln County with nearby schools including Battleground Elementary School, Lincolnton Middle School, and Lincolnton High School.
Ownership History
Date
Name
Owned For
Owner Type
Purchase Details
Closed on
Dec 3, 2019
Sold by
Wylie Jason Lee and Wylie Courtney Krause
Bought by
Zhao Kevin M
Current Estimated Value
Purchase Details
Closed on
Apr 3, 2019
Sold by
Krause Wylie Courtney
Bought by
Krause Wylie Jasan Lee and Krause Wylie Courtntey
Purchase Details
Closed on
Sep 12, 2016
Sold by
Wylie Courtney Krause and Wylie Jason
Bought by
Wylie Courtney Krause
Purchase Details
Closed on
Sep 7, 2016
Sold by
Secretary Of Housing & Urban Development
Bought by
Wiley Courtney Krause
Purchase Details
Closed on
Jan 13, 2016
Sold by
Phh Mortgage Corp
Bought by
Secretary Of Housing & Urban Development
Purchase Details
Closed on
Oct 23, 2015
Sold by
Romero Linda G and Romero Linda Gayle
Bought by
Phh Mortgage Corp
Purchase Details
Closed on
Aug 28, 1997
Bought by
Romero Linda G
Purchase Details
Closed on
Aug 29, 1995
Bought by
Rinehardt Terry Lee and Daniel Austi
Create a Home Valuation Report for This Property
The Home Valuation Report is an in-depth analysis detailing your home's value as well as a comparison with similar homes in the area
Home Values in the Area
Average Home Value in this Area
Purchase History
| Date | Buyer | Sale Price | Title Company |
|---|---|---|---|
| Zhao Kevin M | -- | None Available | |
| Krause Wylie Jasan Lee | -- | None Available | |
| Wylie Courtney Krause | -- | None Available | |
| Wiley Courtney Krause | -- | None Available | |
| Secretary Of Housing & Urban Development | -- | None Available | |
| Phh Mortgage Corp | $86,000 | None Available | |
| Romero Linda G | $76,000 | -- | |
| Rinehardt Terry Lee | $12,000 | -- |
Source: Public Records
Tax History Compared to Growth
Tax History
| Year | Tax Paid | Tax Assessment Tax Assessment Total Assessment is a certain percentage of the fair market value that is determined by local assessors to be the total taxable value of land and additions on the property. | Land | Improvement |
|---|---|---|---|---|
| 2025 | $1,159 | $168,691 | $27,000 | $141,691 |
| 2024 | $1,139 | $168,691 | $27,000 | $141,691 |
| 2023 | $1,109 | $168,691 | $27,000 | $141,691 |
| 2022 | $751 | $89,738 | $23,000 | $66,738 |
| 2021 | $733 | $89,738 | $23,000 | $66,738 |
| 2020 | $600 | $89,738 | $23,000 | $66,738 |
| 2019 | $600 | $89,738 | $23,000 | $66,738 |
| 2018 | $675 | $84,266 | $21,000 | $63,266 |
| 2017 | $549 | $84,266 | $21,000 | $63,266 |
| 2016 | $549 | $84,266 | $21,000 | $63,266 |
| 2015 | $624 | $84,266 | $21,000 | $63,266 |
| 2014 | $666 | $92,098 | $23,500 | $68,598 |
Source: Public Records
Map
Nearby Homes
- 980 Lakeland Ave
- 3124 Banks St
- 0 Eva Ct
- 2845 Wood Gate Rd
- 1484 Null Rd
- 1870 Grace Ct
- 1540 Null Rd
- Lot 72 & 73 Meandering Ln Unit 72 & 73
- 00 Meandering Ln
- 00 Sunrise Trail
- 4594 Harris Elliot Rd
- 4603 Harris Elliot Rd
- 4595 Harris Elliot Rd
- 4590 Harris Elliot Rd
- 2616 Carriage Ln
- 4583 Harris Elliot Rd
- 4586 Harris Elliot Rd
- 4548 Harris Elliot Rd
- 4578 Harris Elliot Rd
- 00 Park Cir
- 1124 Highland Bluff Ct Unit 4
- 1136 Highland Bluff Ct
- 1110 Highland Bluff Ct
- 1124 Highland
- 1148 Highland Bluff Ct
- 1362 Highland Dr
- 1119 Highland Bluff Ct
- 1131 Highland Bluff Ct
- 1080 Highland Bluff Ct
- 1109 Highland Bluff Ct
- 1143 Highland Bluff Ct
- 1156 Highland Bluff Ct
- 1099 Highland Bluff Ct
- 1155 Highland Bluff Ct
- 1058 Highland Bluff Ct
- 1170 Highland Bluff Ct
- 1087 Highland Bluff Ct
- 1173 Highland
- 1173 Highland Bluff Ct
- 0 Springwater Ln Unit 143