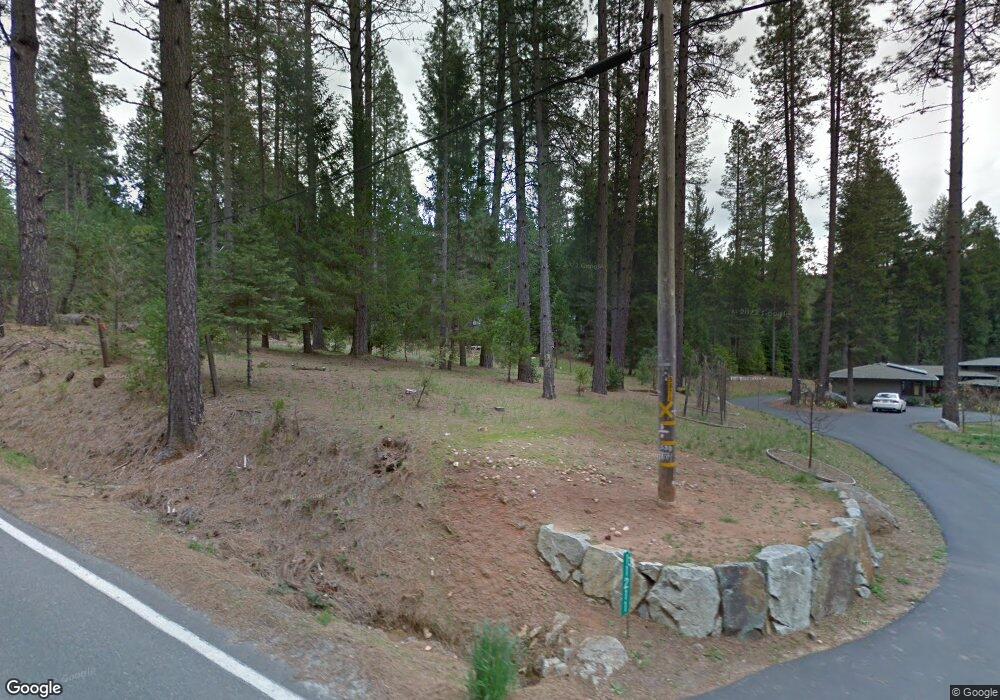
11241 Willow Valley Rd Nevada City, CA 95959
Estimated Value: $474,000 - $648,000
2
Beds
2
Baths
--
Sq Ft
1.4
Acres
About This Home
This home is located at 11241 Willow Valley Rd, Nevada City, CA 95959 and is currently estimated at $575,354. 11241 Willow Valley Rd is a home located in Nevada County with nearby schools including Deer Creek Elementary School, Seven Hills Intermediate School, and Forest Charter School.
Ownership History
Date
Name
Owned For
Owner Type
Purchase Details
Closed on
Oct 9, 2009
Sold by
Mohr Garry and Mohr Brenda
Bought by
Mohr Garry and Mohr Brenda
Current Estimated Value
Purchase Details
Closed on
Feb 24, 2004
Sold by
Truman Donald E and Garnier Martha Lee
Bought by
Mohr Garry and Mohr Brenda
Purchase Details
Closed on
Jan 16, 2004
Sold by
Truman Donald E and Garnier Martha Lee
Bought by
Truman Donald E
Purchase Details
Closed on
Jan 7, 2004
Sold by
Truman Donald E
Bought by
Truman Donald E and Garnier Martha Lee
Purchase Details
Closed on
May 2, 2003
Sold by
Truman Donald E
Bought by
Truman Donald E and Garnier Martha Lee
Purchase Details
Closed on
Aug 27, 2002
Sold by
Garnier Martha Lee
Bought by
Garnier Martha Lee
Purchase Details
Closed on
Mar 12, 2002
Sold by
Truman Donald E
Bought by
Truman Donald E
Create a Home Valuation Report for This Property
The Home Valuation Report is an in-depth analysis detailing your home's value as well as a comparison with similar homes in the area
Home Values in the Area
Average Home Value in this Area
Purchase History
| Date | Buyer | Sale Price | Title Company |
|---|---|---|---|
| Mohr Garry | -- | None Available | |
| Mohr Gary | -- | None Available | |
| Mohr Garry | -- | Fidelity National Title Co | |
| Mohr Garry | $176,500 | Fidelity National Title Co | |
| Truman Donald E | -- | -- | |
| Truman Donald E | -- | -- | |
| Truman Donald E | -- | -- | |
| Truman Donald E | -- | -- | |
| Garnier Martha Lee | -- | -- | |
| Truman Donald E | -- | -- | |
| Garnier Martha Lee | -- | -- | |
| Truman Donald E | -- | -- |
Source: Public Records
Tax History Compared to Growth
Tax History
| Year | Tax Paid | Tax Assessment Tax Assessment Total Assessment is a certain percentage of the fair market value that is determined by local assessors to be the total taxable value of land and additions on the property. | Land | Improvement |
|---|---|---|---|---|
| 2025 | $5,781 | $539,229 | $256,626 | $282,603 |
| 2024 | $5,668 | $528,657 | $251,595 | $277,062 |
| 2023 | $5,668 | $518,292 | $246,662 | $271,630 |
| 2022 | $5,552 | $508,130 | $241,826 | $266,304 |
| 2021 | $5,408 | $498,168 | $237,085 | $261,083 |
| 2020 | $5,395 | $493,060 | $234,654 | $258,406 |
| 2019 | $5,286 | $483,393 | $230,053 | $253,340 |
| 2018 | $0 | $473,916 | $225,543 | $248,373 |
| 2017 | $4,797 | $437,487 | $216,219 | $221,268 |
| 2016 | $3,582 | $328,000 | $144,000 | $184,000 |
| 2015 | $3,489 | $319,000 | $140,000 | $179,000 |
| 2014 | $3,313 | $301,000 | $132,000 | $169,000 |
Source: Public Records
Map
Nearby Homes
- 10730 Jasper Agate Ct
- 11937 Incline Shaft Rd
- 10952 Northcote Place
- 11877 Incline Shaft Rd
- 11417 Red Dog Rd
- 10107 Shekinah Hill Rd
- 15455 Old Washington Rd
- 12043 Pasquale Rd
- 251 Willow Valley Rd Unit 17
- 728 Old Washington Rd
- 803 Uren St
- 260 Boulder St
- 11945 Rocker Rd
- 157 Grove St
- 10950 Banning Way
- 347 Nile St
- 439 Washington St
- 134 Boulder St
- 11797 Cedar Springs Rd
- 506 Silva Ave
- 11309 Willow Valley Rd
- 11293 Willow Valley Rd
- 11211 Willow Valley Rd
- 11256 Willow Valley Rd
- 11327 Willow Valley Rd
- 11169 Willow Valley Rd
- 11137 Willow Valley Rd
- 11194 Willow Valley Rd
- 11334 Willow Valley Rd
- 11367 Willow Valley Rd
- 11333 Willow Valley Rd
- 11139 Willow Valley Rd
- 11150 Willow Valley Rd
- 11289 Willow Valley Rd
- 11181 Willow Valley Rd
- 11356 Willow Valley Rd
- 11395 Willow Valley Rd
- 11380 Willow Valley Rd
- 11119 Hill Creek Dr