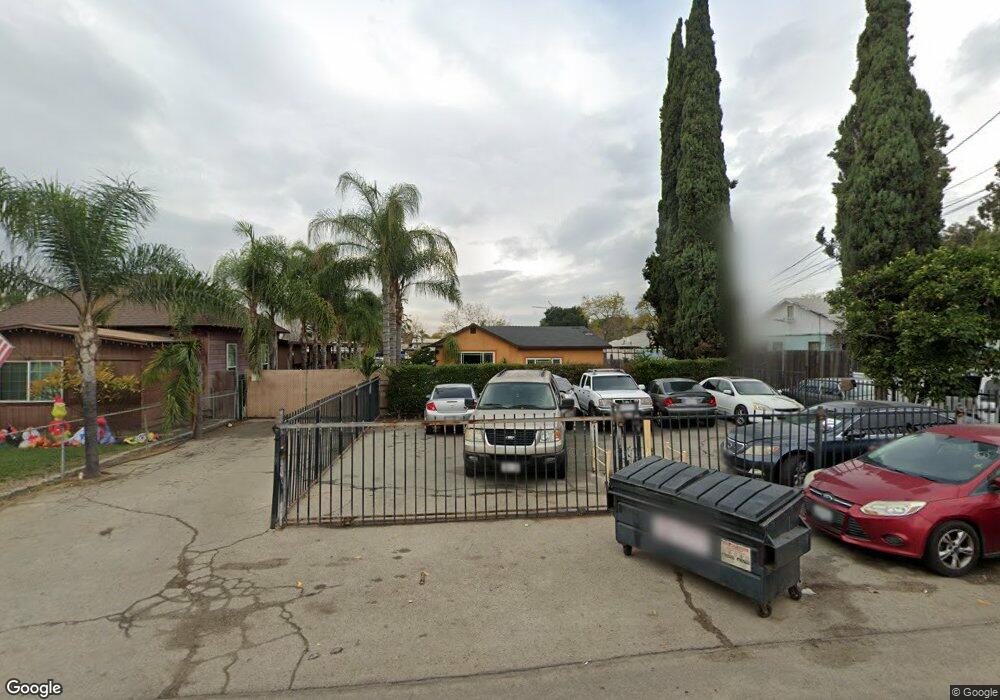
11242 Kadota Ave Pomona, CA 91766
Estimated Value: $508,000 - $823,000
2
Beds
2
Baths
2,075
Sq Ft
$326/Sq Ft
Est. Value
About This Home
This home is located at 11242 Kadota Ave, Pomona, CA 91766 and is currently estimated at $675,645, approximately $325 per square foot. 11242 Kadota Ave is a home located in San Bernardino County with nearby schools including Ramona Elementary School, Serrano Middle School, and Montclair High School.
Ownership History
Date
Name
Owned For
Owner Type
Purchase Details
Closed on
Mar 9, 2010
Sold by
Sanchez Alicia
Bought by
Sanchez Ruben
Current Estimated Value
Home Financials for this Owner
Home Financials are based on the most recent Mortgage that was taken out on this home.
Original Mortgage
$100,000
Interest Rate
4.95%
Mortgage Type
Seller Take Back
Purchase Details
Closed on
Feb 9, 2010
Sold by
Lovio David
Bought by
Sanchez Felipe and Sanchez Ruben
Home Financials for this Owner
Home Financials are based on the most recent Mortgage that was taken out on this home.
Original Mortgage
$100,000
Interest Rate
4.95%
Mortgage Type
Seller Take Back
Purchase Details
Closed on
Jan 13, 1999
Sold by
Keefe John W and Keefe Alberta
Bought by
Lovio David and Lovio Elizabeth
Purchase Details
Closed on
Mar 14, 1992
Sold by
Keefe Alberta
Bought by
Keefe Alberta and Keefe John W
Create a Home Valuation Report for This Property
The Home Valuation Report is an in-depth analysis detailing your home's value as well as a comparison with similar homes in the area
Home Values in the Area
Average Home Value in this Area
Purchase History
| Date | Buyer | Sale Price | Title Company |
|---|---|---|---|
| Sanchez Ruben | -- | Chicago Title Company | |
| Sanchez Felipe | $300,000 | Chicago Title Company | |
| Lovio David | -- | -- | |
| Keefe Alberta | -- | -- |
Source: Public Records
Mortgage History
| Date | Status | Borrower | Loan Amount |
|---|---|---|---|
| Previous Owner | Sanchez Felipe | $100,000 |
Source: Public Records
Tax History Compared to Growth
Tax History
| Year | Tax Paid | Tax Assessment Tax Assessment Total Assessment is a certain percentage of the fair market value that is determined by local assessors to be the total taxable value of land and additions on the property. | Land | Improvement |
|---|---|---|---|---|
| 2025 | $4,192 | $387,247 | $200,078 | $187,169 |
| 2024 | $4,192 | $379,654 | $196,155 | $183,499 |
| 2023 | $4,074 | $372,210 | $192,309 | $179,901 |
| 2022 | $4,020 | $364,912 | $188,538 | $176,374 |
| 2021 | $3,995 | $357,757 | $184,841 | $172,916 |
| 2020 | $3,925 | $354,089 | $182,946 | $171,143 |
| 2019 | $3,892 | $347,146 | $179,359 | $167,787 |
| 2018 | $3,838 | $340,339 | $175,842 | $164,497 |
| 2017 | $3,701 | $333,666 | $172,394 | $161,272 |
| 2016 | $3,556 | $327,124 | $169,014 | $158,110 |
| 2015 | $3,532 | $322,210 | $166,475 | $155,735 |
| 2014 | $3,412 | $315,898 | $163,214 | $152,684 |
Source: Public Records
Map
Nearby Homes
- 11211 Chico Ave
- 3944 E 9th St
- 11457 Brunswick Ln
- 10991 Pipeline Ave
- 4161 Mission Blvd Unit 2
- 4361 Mission Blvd Unit 116
- 4361 Mission Blvd Unit 100
- 4361 Mission Blvd Unit 121
- 4361 Mission Blvd Unit 80
- 11250 Ramona Ave
- 11250 Ramona Ave Unit 216
- 3921 Francis Ave
- 4444 Merle St
- 1330 S Reservoir St
- 1063 S Reservoir St
- 11610 Sherwood Place
- 11620 Sherwood Place
- 1125 E Grand Ave Unit A
- Maddox Plan at Yorba Estates
- Malone Plan at Yorba Estates
- 11234 Kadota Ave
- 11252 Kadota Ave
- 11226 Kadota Ave
- 11264 Kadota Ave
- 11253 Roswell Ave
- 11216 Kadota Ave
- 3968 E Grand Ave
- 11206 Kadota Ave
- 11233 Kadota Ave
- 11263 Kadota Ave
- 11198 Kadota Ave
- 11192 Kadota Ave
- 11225 Kadota Ave
- 11241 Kadota Ave
- 3860 Grand Ave
- 11253 Kadota Ave
- 11188 Kadota Ave
- 11223 Roswell Ave
- 11267 Roswell Ave
- 11193 Kadota Ave