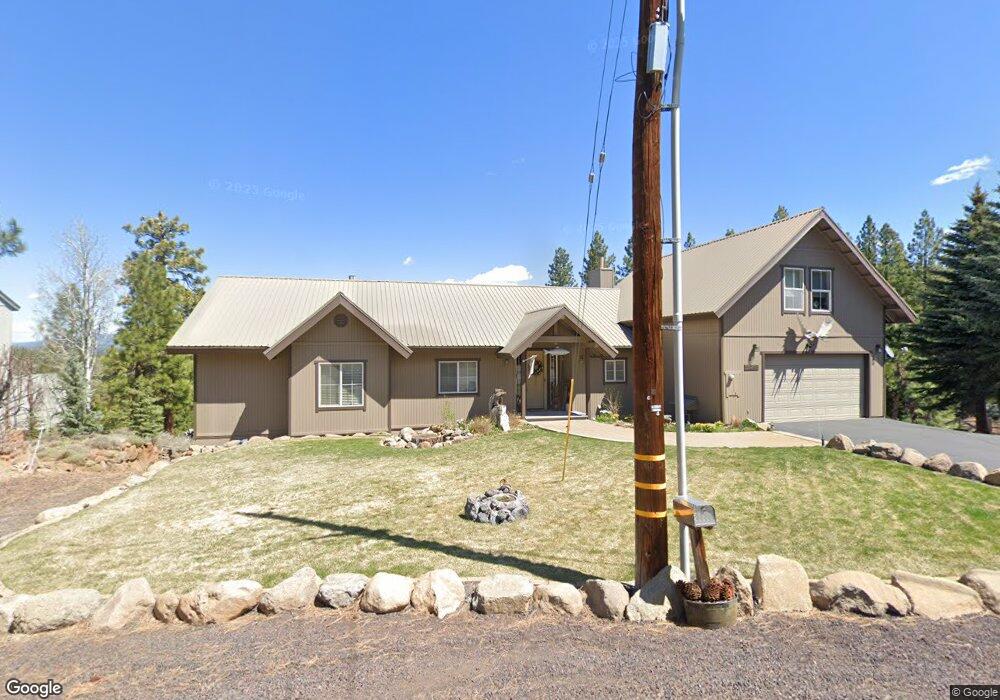
11245 Huntsman Leap Truckee, CA 96161
Glenshire-Devonshire NeighborhoodEstimated Value: $1,232,000 - $1,415,000
3
Beds
3
Baths
2,856
Sq Ft
$469/Sq Ft
Est. Value
About This Home
This home is located at 11245 Huntsman Leap, Truckee, CA 96161 and is currently estimated at $1,338,712, approximately $468 per square foot. 11245 Huntsman Leap is a home located in Nevada County with nearby schools including Glenshire Elementary School, Alder Creek Middle School, and Tahoe Truckee High School.
Ownership History
Date
Name
Owned For
Owner Type
Purchase Details
Closed on
Aug 22, 2025
Sold by
Krampert Mark
Bought by
Krampert Family Trust and Krampert
Current Estimated Value
Purchase Details
Closed on
Aug 18, 2025
Sold by
Krampert Leslie
Bought by
Lukowitsch Trust and Krampert
Purchase Details
Closed on
Aug 7, 2025
Sold by
Krampert Scott
Bought by
Scott And Jacie Krampert Revocable Trust and Krampert
Purchase Details
Closed on
Jan 31, 1997
Sold by
Consolidated Mutual Assets
Bought by
Krampert Marlon and Krampert Scott
Home Financials for this Owner
Home Financials are based on the most recent Mortgage that was taken out on this home.
Original Mortgage
$23,000
Interest Rate
7.9%
Mortgage Type
Seller Take Back
Create a Home Valuation Report for This Property
The Home Valuation Report is an in-depth analysis detailing your home's value as well as a comparison with similar homes in the area
Home Values in the Area
Average Home Value in this Area
Purchase History
| Date | Buyer | Sale Price | Title Company |
|---|---|---|---|
| Krampert Family Trust | -- | None Listed On Document | |
| Krampert Family Trust | -- | None Listed On Document | |
| Lukowitsch Trust | -- | None Listed On Document | |
| Lukowitsch Trust | -- | None Listed On Document | |
| Scott And Jacie Krampert Revocable Trust | -- | None Listed On Document | |
| Scott And Jacie Krampert Revocable Trust | -- | None Listed On Document | |
| Krampert Marlon | $28,000 | Fidelity National Title Co |
Source: Public Records
Mortgage History
| Date | Status | Borrower | Loan Amount |
|---|---|---|---|
| Previous Owner | Krampert Marlon | $23,000 |
Source: Public Records
Tax History Compared to Growth
Tax History
| Year | Tax Paid | Tax Assessment Tax Assessment Total Assessment is a certain percentage of the fair market value that is determined by local assessors to be the total taxable value of land and additions on the property. | Land | Improvement |
|---|---|---|---|---|
| 2025 | $7,165 | $516,359 | $115,662 | $400,697 |
| 2024 | $7,070 | $506,236 | $113,395 | $392,841 |
| 2023 | $7,070 | $496,311 | $111,172 | $385,139 |
| 2022 | $6,899 | $486,581 | $108,993 | $377,588 |
| 2021 | $6,552 | $477,041 | $106,856 | $370,185 |
| 2020 | $6,499 | $472,151 | $105,761 | $366,390 |
| 2019 | $6,482 | $462,894 | $103,688 | $359,206 |
| 2018 | $5,894 | $453,818 | $101,655 | $352,163 |
| 2017 | $5,752 | $444,921 | $99,663 | $345,258 |
| 2016 | $5,701 | $436,199 | $97,710 | $338,489 |
| 2015 | $5,575 | $429,649 | $96,244 | $333,405 |
| 2014 | $5,361 | $421,234 | $94,359 | $326,875 |
Source: Public Records
Map
Nearby Homes
- 15659 Archery View
- 12976 Sierra Vista Ct
- 12955 Sierra Vista Ct
- 10583 Laburnham Cir
- 10480 Evensham Place
- 15518 Chelmsford
- 15439 Chelmsford
- 10390 Manchester Dr
- 15865 Exeter Ct
- 15031 Glenshire Dr
- 16029 Glenshire Dr
- 10703 Winchester Ct
- 10668 Winchester Ct
- 16338 Lance Dr
- 16332 Havern Hill Ct
- 10683 Winchester Ct
- 10554 Courtenay Ln
- 10729 Courtenay Ln
- 10129 Hirschdale Rd
- 15675 Donnington Ln
- 11263 Huntsman Leap
- 11225 Huntsman Leap
- 11246 Huntsman Leap
- 11215 Huntsman Leap
- 11279 Huntsman Leap
- 11214 Huntsman Leap
- 11298 Huntsman Leap
- 11205 Huntsman Leap
- 11297 Huntsman Leap
- 11195 Huntsman Leap
- 11307 Huntsman Leap
- 11194 Huntsman Leap
- 11328 Huntsman Leap
- 11348 Huntsman Leap
- 11185 Huntsman Leap
- 11317 Huntsman Leap
- 11186 Huntsman Leap
- 11327 Huntsman Leap
- 11358 Huntsman Leap
- 11168 Huntsman Leap