Estimated Value: $344,226 - $409,000
3
Beds
3
Baths
1,732
Sq Ft
$215/Sq Ft
Est. Value
About This Home
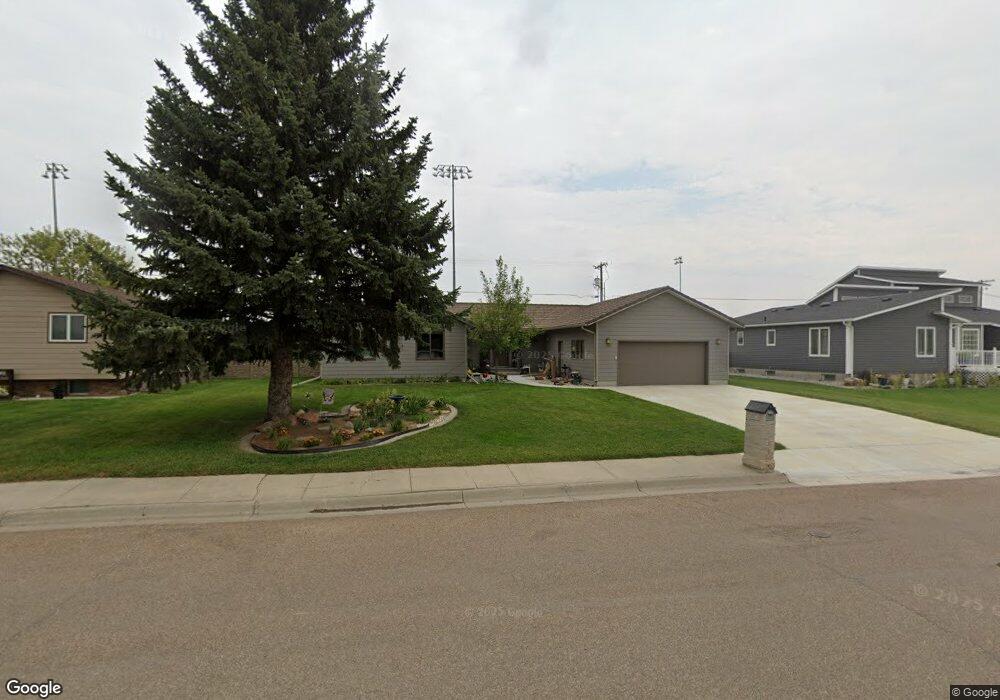
This home is located at 1125 11th St, Havre, MT 59501 and is currently estimated at $372,557, approximately $215 per square foot. 1125 11th St is a home located in Hill County with nearby schools including Highland Park Early Primary School, Sunnyside School, and Lincoln-McKinley School.
Ownership History
Date
Name
Owned For
Owner Type
Purchase Details
Closed on
Jul 11, 2013
Sold by
Linday Linday and Lorang Jacob
Bought by
Sticka Robert L and Sticka Marylou
Current Estimated Value
Home Financials for this Owner
Home Financials are based on the most recent Mortgage that was taken out on this home.
Original Mortgage
$187,999
Outstanding Balance
$137,049
Interest Rate
3.98%
Mortgage Type
New Conventional
Estimated Equity
$235,508
Purchase Details
Closed on
Sep 8, 2012
Sold by
Rhines Debi K and Schend Robert W
Bought by
Lorang Jacob F and Lorang Lindsay A
Create a Home Valuation Report for This Property
The Home Valuation Report is an in-depth analysis detailing your home's value as well as a comparison with similar homes in the area
Purchase History
| Date | Buyer | Sale Price | Title Company |
|---|---|---|---|
| Sticka Robert L | -- | Hill County Title Co | |
| Lorang Jacob F | -- | -- |
Source: Public Records
Mortgage History
| Date | Status | Borrower | Loan Amount |
|---|---|---|---|
| Open | Sticka Robert L | $187,999 |
Source: Public Records
Tax History
| Year | Tax Paid | Tax Assessment Tax Assessment Total Assessment is a certain percentage of the fair market value that is determined by local assessors to be the total taxable value of land and additions on the property. | Land | Improvement |
|---|---|---|---|---|
| 2025 | $2,862 | $334,100 | $0 | $0 |
| 2024 | $3,564 | $282,500 | $0 | $0 |
| 2023 | $3,484 | $282,500 | $0 | $0 |
| 2022 | $3,179 | $251,000 | $0 | $0 |
| 2021 | $2,567 | $251,000 | $0 | $0 |
| 2020 | $3,223 | $249,500 | $0 | $0 |
| 2019 | $3,227 | $249,500 | $0 | $0 |
| 2018 | $2,970 | $219,500 | $0 | $0 |
| 2017 | $2,981 | $219,500 | $0 | $0 |
| 2016 | $2,983 | $220,800 | $0 | $0 |
| 2015 | $2,605 | $220,800 | $0 | $0 |
| 2014 | $1,943 | $95,453 | $0 | $0 |
Source: Public Records
Map
Nearby Homes
Your Personal Tour Guide
Ask me questions while you tour the home.