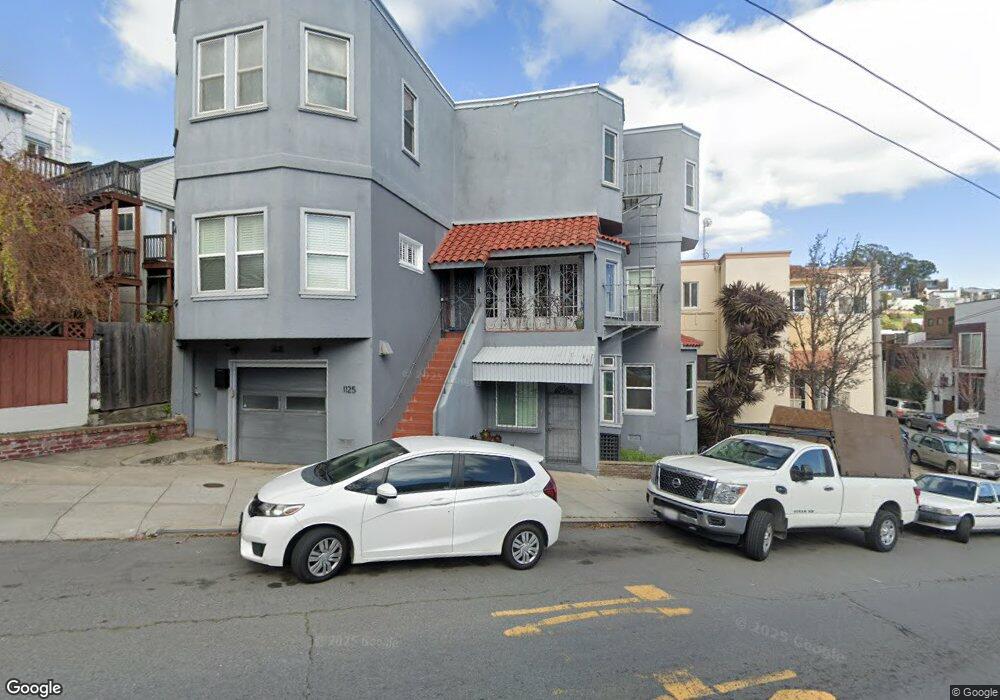
1125 Cortland Ave San Francisco, CA 94110
Bernal Heights NeighborhoodEstimated Value: $2,069,266 - $2,550,000
--
Bed
3
Baths
2,540
Sq Ft
$923/Sq Ft
Est. Value
About This Home
This home is located at 1125 Cortland Ave, San Francisco, CA 94110 and is currently estimated at $2,343,567, approximately $922 per square foot. 1125 Cortland Ave is a home located in San Francisco County with nearby schools including Serra (Junipero) Elementary School, Hoover (Herbert) Middle School, and Donum Dei Classical Academy.
Ownership History
Date
Name
Owned For
Owner Type
Purchase Details
Closed on
Feb 22, 2019
Sold by
Lim Wailoong and Lim Yong Lisa
Bought by
Lim Wailoong and Lim Yong Lisa
Current Estimated Value
Purchase Details
Closed on
Apr 18, 2005
Sold by
Carnicelli Sharon and Perkins John E
Bought by
Lim Wai Loong and Yong Lisa
Home Financials for this Owner
Home Financials are based on the most recent Mortgage that was taken out on this home.
Original Mortgage
$650,000
Outstanding Balance
$345,604
Interest Rate
6.25%
Mortgage Type
Fannie Mae Freddie Mac
Estimated Equity
$1,997,963
Purchase Details
Closed on
May 6, 2002
Sold by
Diaz Cipriano A and Diaz Aradora B
Bought by
Carnicelli Sharon and Perkins John E
Home Financials for this Owner
Home Financials are based on the most recent Mortgage that was taken out on this home.
Original Mortgage
$464,000
Interest Rate
8.99%
Create a Home Valuation Report for This Property
The Home Valuation Report is an in-depth analysis detailing your home's value as well as a comparison with similar homes in the area
Home Values in the Area
Average Home Value in this Area
Purchase History
| Date | Buyer | Sale Price | Title Company |
|---|---|---|---|
| Lim Wailoong | -- | None Available | |
| Lim Wai Loong | $950,000 | First American Title Company | |
| Carnicelli Sharon | $580,000 | Fidelity National Title Co |
Source: Public Records
Mortgage History
| Date | Status | Borrower | Loan Amount |
|---|---|---|---|
| Open | Lim Wai Loong | $650,000 | |
| Previous Owner | Carnicelli Sharon | $464,000 | |
| Closed | Carnicelli Sharon | $116,000 | |
| Closed | Lim Wai Loong | $110,000 |
Source: Public Records
Tax History Compared to Growth
Tax History
| Year | Tax Paid | Tax Assessment Tax Assessment Total Assessment is a certain percentage of the fair market value that is determined by local assessors to be the total taxable value of land and additions on the property. | Land | Improvement |
|---|---|---|---|---|
| 2025 | $15,915 | $1,324,201 | $794,522 | $529,679 |
| 2024 | $15,915 | $1,298,238 | $778,944 | $519,294 |
| 2023 | $15,673 | $1,272,783 | $763,671 | $509,112 |
| 2022 | $15,371 | $1,247,828 | $748,698 | $499,130 |
| 2021 | $15,097 | $1,223,362 | $734,018 | $489,344 |
| 2020 | $15,217 | $1,210,819 | $726,492 | $484,327 |
| 2019 | $14,697 | $1,187,079 | $712,248 | $474,831 |
| 2018 | $14,233 | $1,166,918 | $698,283 | $468,635 |
| 2017 | $13,767 | $1,144,100 | $684,592 | $459,508 |
| 2016 | $13,537 | $1,121,729 | $671,169 | $450,560 |
| 2015 | $13,330 | $1,101,813 | $661,088 | $440,725 |
| 2014 | $12,977 | $1,080,231 | $648,139 | $432,092 |
Source: Public Records
Map
Nearby Homes
- 242 Prentiss St
- 300 Prentiss St
- 236 Prentiss St
- 249 Banks St
- 243 Banks St
- 237 Banks St
- 310 Prentiss St
- 255 Banks St
- 230 Prentiss St
- 231 Banks St
- 316 Prentiss St
- 225 Banks St
- 226 Prentiss St
- 1100 Cortland Ave
- 219 Prentiss St
- 322 Prentiss St
- 305 Prentiss St
- 212 Prentiss St
- 309 Prentiss St
- 215 Banks St