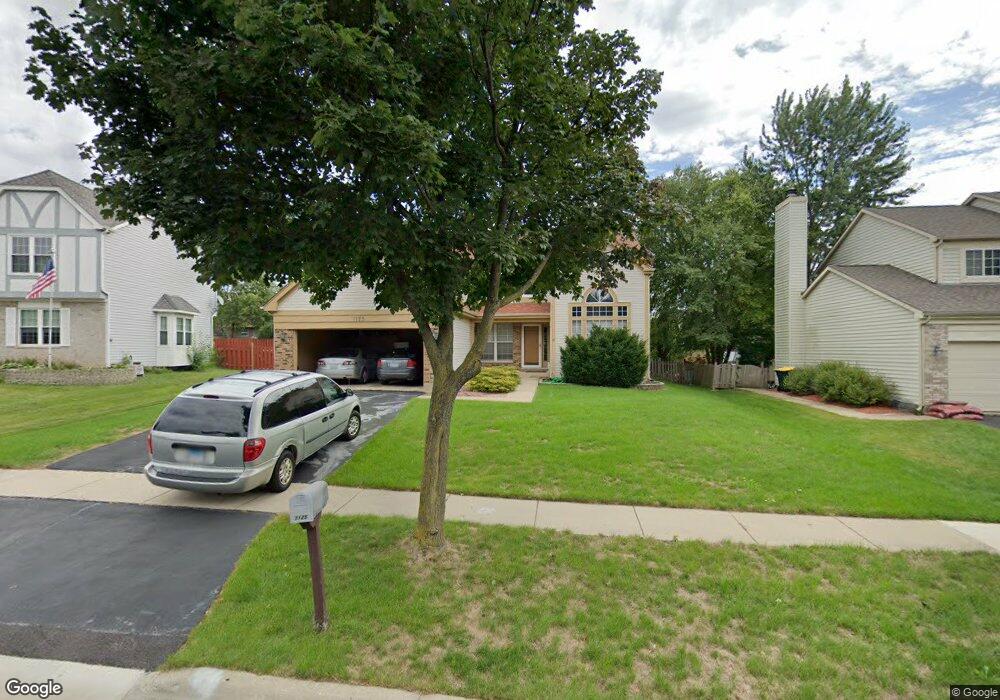
1125 Edington Ln Carol Stream, IL 60188
Estimated Value: $498,000 - $536,000
4
Beds
3
Baths
2,209
Sq Ft
$232/Sq Ft
Est. Value
About This Home
This home is located at 1125 Edington Ln, Carol Stream, IL 60188 and is currently estimated at $512,818, approximately $232 per square foot. 1125 Edington Ln is a home located in DuPage County with nearby schools including Cloverdale Elementary School, Jay Stream Middle School, and Glenbard North High School.
Ownership History
Date
Name
Owned For
Owner Type
Purchase Details
Closed on
Nov 10, 2014
Sold by
Patel Yogen M and Patel Mala Y
Bought by
Yogen M & Mala Y Patel Joint Tenancy Tru
Current Estimated Value
Purchase Details
Closed on
May 31, 2000
Sold by
Colon Wifredo A and Colon Jacqueline S
Bought by
Patel Yogen M and Patel Mala Y
Home Financials for this Owner
Home Financials are based on the most recent Mortgage that was taken out on this home.
Original Mortgage
$182,000
Outstanding Balance
$63,979
Interest Rate
8.18%
Estimated Equity
$448,839
Purchase Details
Closed on
Jul 28, 1995
Sold by
Wagner Jeffrey A and Wagner Lora L
Bought by
Colon Wilfredo A and Colon Jacqueline S
Home Financials for this Owner
Home Financials are based on the most recent Mortgage that was taken out on this home.
Original Mortgage
$201,400
Interest Rate
5.87%
Create a Home Valuation Report for This Property
The Home Valuation Report is an in-depth analysis detailing your home's value as well as a comparison with similar homes in the area
Home Values in the Area
Average Home Value in this Area
Purchase History
| Date | Buyer | Sale Price | Title Company |
|---|---|---|---|
| Yogen M & Mala Y Patel Joint Tenancy Tru | -- | None Available | |
| Patel Yogen M | $265,000 | -- | |
| Colon Wilfredo A | $212,000 | -- |
Source: Public Records
Mortgage History
| Date | Status | Borrower | Loan Amount |
|---|---|---|---|
| Open | Patel Yogen M | $182,000 | |
| Previous Owner | Colon Wilfredo A | $201,400 |
Source: Public Records
Tax History Compared to Growth
Tax History
| Year | Tax Paid | Tax Assessment Tax Assessment Total Assessment is a certain percentage of the fair market value that is determined by local assessors to be the total taxable value of land and additions on the property. | Land | Improvement |
|---|---|---|---|---|
| 2024 | $10,888 | $134,916 | $29,557 | $105,359 |
| 2023 | $10,309 | $123,380 | $27,030 | $96,350 |
| 2022 | $10,704 | $122,030 | $26,320 | $95,710 |
| 2021 | $10,213 | $115,950 | $25,010 | $90,940 |
| 2020 | $10,048 | $113,120 | $24,400 | $88,720 |
| 2019 | $10,200 | $114,330 | $24,680 | $89,650 |
| 2018 | $10,919 | $123,540 | $24,040 | $99,500 |
| 2017 | $10,340 | $114,500 | $22,280 | $92,220 |
| 2016 | $9,808 | $105,970 | $20,620 | $85,350 |
| 2015 | $9,600 | $98,890 | $19,240 | $79,650 |
| 2014 | $9,351 | $94,840 | $15,190 | $79,650 |
| 2013 | $9,396 | $98,090 | $15,710 | $82,380 |
Source: Public Records
Map
Nearby Homes
- 615 Kingsbridge Dr
- 1168 Chalet Dr
- 489 Canterbury Dr Unit 15E
- 1028 Bedford Dr
- 1390 Merrimac Ln N
- 1083 Country Glen Ln
- 385 Wexford Ct Unit 32
- 388 Canyon Trail
- 768 Provincetown Dr Unit 16
- 1309 Coldspring Rd Unit 162
- 3935 Shoreline Dr
- 877 Malibu Ct
- 736 Tama Ct
- 1063 Parkview Cir
- 541 Chippewa Trail
- 712 Aztec Dr
- 1861 Grosse Pointe Cir
- 1885 Grosse Pointe Ct
- 351 Juniper Ct
- 1824 Isle Royal Ln
- 1121 Edington Ln
- 1127 Edington Ln Unit 9
- 1118 Sandhurst Ln
- 1122 Sandhurst Ln
- 1119 Edington Ln
- 1116 Sandhurst Ln
- 1129 Edington Ln
- 1124 Sandhurst Ln
- 1114 Sandhurst Ln
- 1128 Edington Ln
- 1124 Edington Ln
- 1117 Edington Ln
- 1128 Sandhurst Ln
- 1120 Edington Ln Unit 9
- 1131 Edington Ln
- 1132 Edington Ln
- 1112 Sandhurst Ln
- 1118 Edington Ln
- 1130 Sandhurst Ln
- 1115 Edington Ln