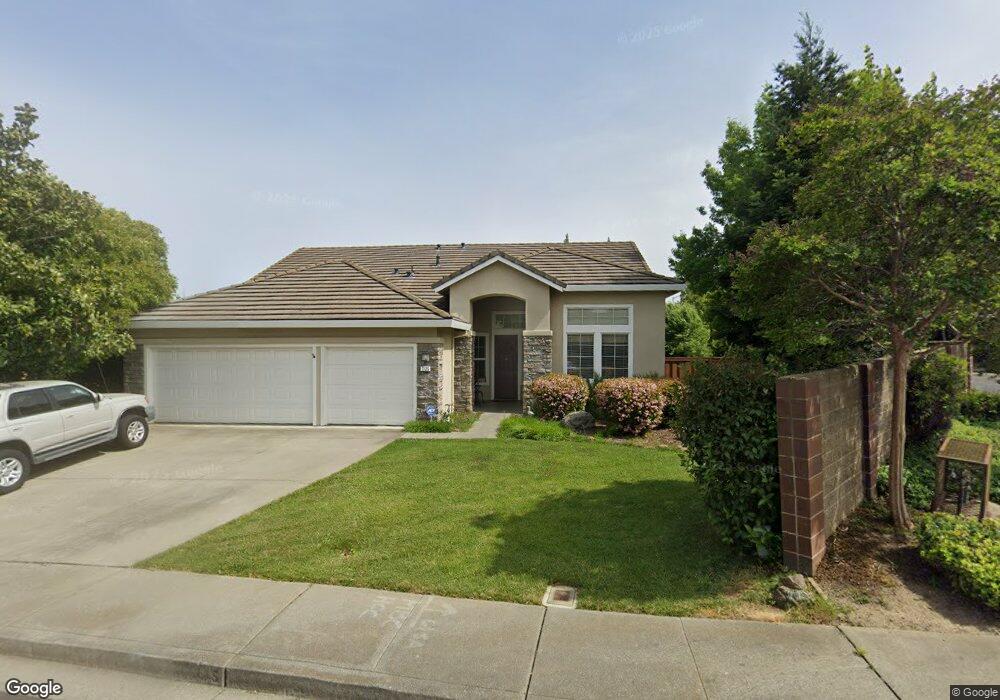
1125 Los Robles St Vacaville, CA 95687
Estimated Value: $703,000 - $805,000
3
Beds
3
Baths
2,443
Sq Ft
$308/Sq Ft
Est. Value
About This Home
This home is located at 1125 Los Robles St, Vacaville, CA 95687 and is currently estimated at $751,555, approximately $307 per square foot. 1125 Los Robles St is a home located in Solano County with nearby schools including Eugene Padan Elementary School, Orchard Elementary School, and Vaca Pena Middle School.
Ownership History
Date
Name
Owned For
Owner Type
Purchase Details
Closed on
Jun 29, 2018
Sold by
Vidt Laura C and Vidt Laurie C
Bought by
Vidt Laura C and Vidt Laurie C
Current Estimated Value
Purchase Details
Closed on
Feb 24, 2018
Sold by
Vidt Laurie C
Bought by
Vidt Laurie C and The Laurie C Vidt Revocable Living Trust
Purchase Details
Closed on
Oct 19, 2016
Sold by
Anderson David S
Bought by
Vidt Laura C
Home Financials for this Owner
Home Financials are based on the most recent Mortgage that was taken out on this home.
Original Mortgage
$397,500
Outstanding Balance
$318,873
Interest Rate
3.48%
Mortgage Type
New Conventional
Estimated Equity
$432,682
Purchase Details
Closed on
Sep 18, 1996
Sold by
Centex Real Estate Corporation
Bought by
Anderson David S and Anderson Patricia D
Home Financials for this Owner
Home Financials are based on the most recent Mortgage that was taken out on this home.
Original Mortgage
$165,000
Interest Rate
7.88%
Create a Home Valuation Report for This Property
The Home Valuation Report is an in-depth analysis detailing your home's value as well as a comparison with similar homes in the area
Purchase History
| Date | Buyer | Sale Price | Title Company |
|---|---|---|---|
| Vidt Laura C | -- | None Available | |
| Vidt Laurie C | -- | None Available | |
| Vidt Laura C | $530,000 | Old Republic Title Company | |
| Anderson David S | $237,000 | First American Title Guarant |
Source: Public Records
Mortgage History
| Date | Status | Borrower | Loan Amount |
|---|---|---|---|
| Open | Vidt Laura C | $397,500 | |
| Previous Owner | Anderson David S | $165,000 |
Source: Public Records
Tax History
| Year | Tax Paid | Tax Assessment Tax Assessment Total Assessment is a certain percentage of the fair market value that is determined by local assessors to be the total taxable value of land and additions on the property. | Land | Improvement |
|---|---|---|---|---|
| 2025 | $7,274 | $615,105 | $145,071 | $470,034 |
| 2024 | $7,274 | $603,045 | $142,227 | $460,818 |
| 2023 | $7,091 | $591,222 | $139,439 | $451,783 |
| 2022 | $6,908 | $579,630 | $136,705 | $442,925 |
| 2021 | $6,868 | $568,266 | $134,025 | $434,241 |
| 2020 | $6,828 | $562,440 | $132,651 | $429,789 |
| 2019 | $6,741 | $551,412 | $130,050 | $421,362 |
| 2018 | $6,671 | $540,600 | $127,500 | $413,100 |
| 2017 | $6,444 | $530,000 | $125,000 | $405,000 |
| 2016 | $4,010 | $325,938 | $82,550 | $243,388 |
| 2015 | $4,013 | $321,044 | $81,311 | $239,733 |
| 2014 | $3,777 | $314,756 | $79,719 | $235,037 |
Source: Public Records
Map
Nearby Homes
- 119 Mesa Ct
- 56 Calle Chapala
- 91 Calle Jalisco
- 118 Calle Chapultepec
- 1079 Portofino Ave
- 331 Bonarda Ct
- 655 Marshall Ct
- 1597 Alamo Dr Unit 150
- 1597 Alamo Dr Unit 128
- 1597 Alamo Dr Unit 140
- 300 Butcher Rd
- 678 Claremont Dr
- 230 James Ct
- 149 Fairoaks Dr
- 214 Albany Ave
- 880 Trysail Ct
- 901 El Camino Ave
- 255 Bowline Dr
- 1919 Forest Ln
- 620 Walnut Ave
- 1119 Los Robles St
- 1124 Laurel Oak Ct
- 1118 Laurel Oak Ct
- 1124 Los Robles St
- 1113 Los Robles St
- 1200 Hidden Oaks Ct
- 1112 Laurel Oak Ct
- 1112 Los Robles St
- 1200 Los Robles Ct
- 1130 Laurel Oak Ct
- 1107 Los Robles St
- 1207 Los Robles Ct
- 1118 Los Robles St
- 1136 Laurel Oak Ct
- 1206 Hidden Oaks Ct
- 1106 Los Robles St
- 1106 Laurel Oak Ct
- 1260 Hidden Oaks Ct
- 1206 Los Robles Ct
Your Personal Tour Guide
Ask me questions while you tour the home.