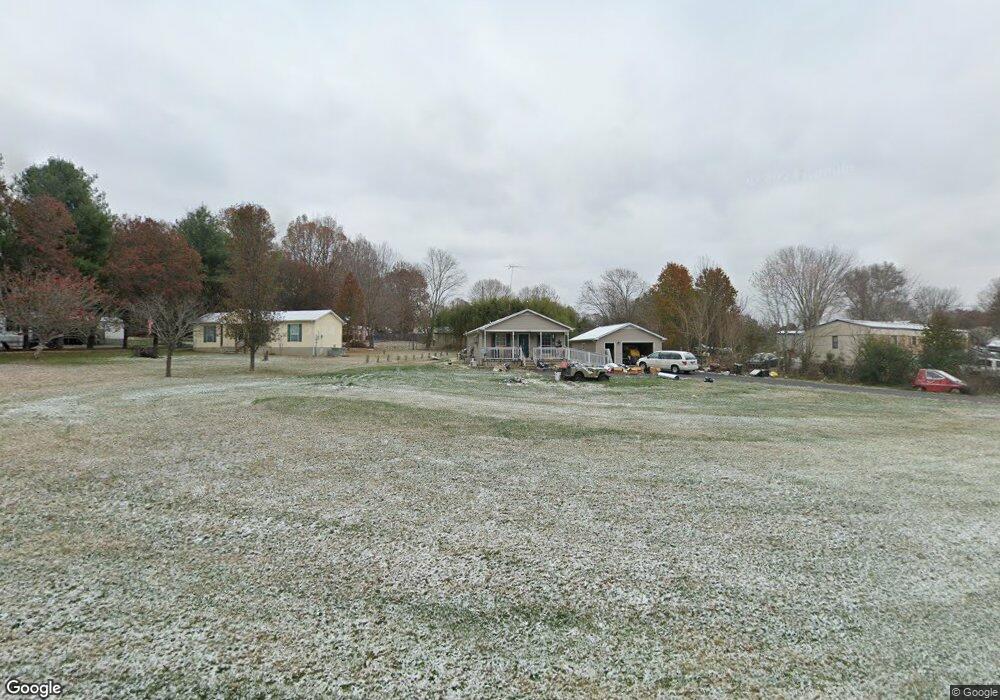
1125 Noel Dr Cookeville, TN 38506
Estimated Value: $131,620 - $213,000
2
Beds
1
Bath
1,021
Sq Ft
$182/Sq Ft
Est. Value
About This Home
This home is located at 1125 Noel Dr, Cookeville, TN 38506 and is currently estimated at $185,905, approximately $182 per square foot. 1125 Noel Dr is a home located in Overton County.
Ownership History
Date
Name
Owned For
Owner Type
Purchase Details
Closed on
Jun 19, 2013
Sold by
Bartlett Jennifer R
Bought by
Bowman David C and Bowman Gwendolyn
Current Estimated Value
Home Financials for this Owner
Home Financials are based on the most recent Mortgage that was taken out on this home.
Original Mortgage
$48,685
Interest Rate
4.19%
Mortgage Type
Cash
Purchase Details
Closed on
Jul 9, 2012
Sold by
Rader Rhonda
Bought by
Rader Rhonda Executrix
Purchase Details
Closed on
Jul 3, 2012
Sold by
Rader Ronda
Bought by
Hall David J
Purchase Details
Closed on
Jun 11, 2012
Sold by
Fish William Dwayne Estate
Bought by
Rader Rhonda
Purchase Details
Closed on
Mar 14, 2011
Sold by
Fish William Dwayne
Bought by
Fish Dwayne Merie
Purchase Details
Closed on
Aug 24, 2009
Sold by
Rander Ronda
Bought by
Fish William Dwayne
Purchase Details
Closed on
Aug 29, 2001
Bought by
Fish Dwayne Merle
Purchase Details
Closed on
Aug 2, 1995
Bought by
Harness Dewayne
Create a Home Valuation Report for This Property
The Home Valuation Report is an in-depth analysis detailing your home's value as well as a comparison with similar homes in the area
Home Values in the Area
Average Home Value in this Area
Purchase History
| Date | Buyer | Sale Price | Title Company |
|---|---|---|---|
| Bowman David C | $70,000 | -- | |
| Rader Rhonda Executrix | -- | -- | |
| Hall David J | $55,000 | -- | |
| Rader Rhonda | -- | -- | |
| Rader Ronda | -- | -- | |
| Fish Dwayne Merie | -- | -- | |
| Fish William Dwayne | -- | -- | |
| Fish Dwayne Merle | $49,900 | -- | |
| Harness Dewayne | $7,000 | -- |
Source: Public Records
Mortgage History
| Date | Status | Borrower | Loan Amount |
|---|---|---|---|
| Previous Owner | Bowman David C | $48,685 |
Source: Public Records
Tax History Compared to Growth
Tax History
| Year | Tax Paid | Tax Assessment Tax Assessment Total Assessment is a certain percentage of the fair market value that is determined by local assessors to be the total taxable value of land and additions on the property. | Land | Improvement |
|---|---|---|---|---|
| 2024 | $444 | $19,725 | $1,750 | $17,975 |
| 2023 | $389 | $19,725 | $1,750 | $17,975 |
| 2022 | $389 | $19,725 | $1,750 | $17,975 |
| 2021 | $389 | $19,725 | $1,750 | $17,975 |
| 2020 | $389 | $19,725 | $1,750 | $17,975 |
| 2019 | $415 | $18,450 | $1,750 | $16,700 |
| 2018 | $415 | $18,450 | $1,750 | $16,700 |
| 2017 | $386 | $18,450 | $1,750 | $16,700 |
| 2016 | $386 | $17,175 | $1,750 | $15,425 |
| 2015 | $342 | $17,175 | $1,750 | $15,425 |
| 2014 | -- | $17,175 | $1,750 | $15,425 |
| 2013 | -- | $16,600 | $0 | $0 |
Source: Public Records
Map
Nearby Homes