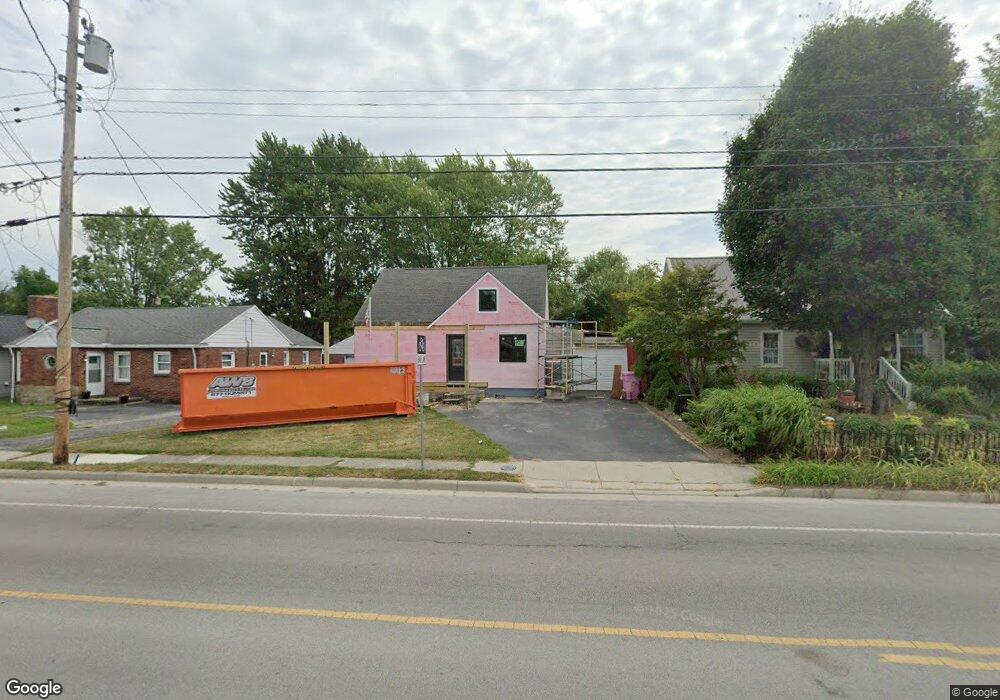
1125 S Blanchard St Findlay, OH 45840
Estimated Value: $66,796 - $151,000
1
Bed
1
Bath
810
Sq Ft
$152/Sq Ft
Est. Value
About This Home
This home is located at 1125 S Blanchard St, Findlay, OH 45840 and is currently estimated at $123,199, approximately $152 per square foot. 1125 S Blanchard St is a home located in Hancock County with nearby schools including Whittier Elementary School, Wilson Vance Elementary School, and Donnell Middle School.
Ownership History
Date
Name
Owned For
Owner Type
Purchase Details
Closed on
Mar 28, 2025
Sold by
Dehring Debra D
Bought by
Jim May Properties Llc
Current Estimated Value
Purchase Details
Closed on
Jul 26, 2005
Sold by
Hindman Lewis J and Hindman Jennifer M
Bought by
Dehring Debra
Home Financials for this Owner
Home Financials are based on the most recent Mortgage that was taken out on this home.
Original Mortgage
$65,200
Interest Rate
5.71%
Mortgage Type
Fannie Mae Freddie Mac
Purchase Details
Closed on
Jun 17, 2002
Sold by
Fout Daniel L
Bought by
Hindman Lewis J Jennifer M
Home Financials for this Owner
Home Financials are based on the most recent Mortgage that was taken out on this home.
Original Mortgage
$71,500
Interest Rate
6.87%
Mortgage Type
New Conventional
Purchase Details
Closed on
Aug 29, 1986
Bought by
Fout Daniel L and Fout Deborah A
Create a Home Valuation Report for This Property
The Home Valuation Report is an in-depth analysis detailing your home's value as well as a comparison with similar homes in the area
Home Values in the Area
Average Home Value in this Area
Purchase History
| Date | Buyer | Sale Price | Title Company |
|---|---|---|---|
| Jim May Properties Llc | $65,000 | Flag City Title | |
| Jim May Properties Llc | $65,000 | Flag City Title | |
| Dehring Debra | $81,500 | Golden Key Title Agency | |
| Hindman Lewis J Jennifer M | $71,500 | -- | |
| Fout Daniel L | $36,000 | -- |
Source: Public Records
Mortgage History
| Date | Status | Borrower | Loan Amount |
|---|---|---|---|
| Previous Owner | Dehring Debra | $65,200 | |
| Previous Owner | Hindman Lewis J Jennifer M | $71,500 |
Source: Public Records
Tax History Compared to Growth
Tax History
| Year | Tax Paid | Tax Assessment Tax Assessment Total Assessment is a certain percentage of the fair market value that is determined by local assessors to be the total taxable value of land and additions on the property. | Land | Improvement |
|---|---|---|---|---|
| 2024 | $937 | $36,180 | $3,400 | $32,780 |
| 2023 | $961 | $36,180 | $3,400 | $32,780 |
| 2022 | $972 | $36,180 | $3,400 | $32,780 |
| 2021 | $1,141 | $28,040 | $3,990 | $24,050 |
| 2020 | $1,141 | $28,040 | $3,990 | $24,050 |
| 2019 | $1,118 | $28,040 | $3,990 | $24,050 |
| 2018 | $1,200 | $27,560 | $3,990 | $23,570 |
| 2017 | $599 | $27,560 | $3,990 | $23,570 |
| 2016 | $1,190 | $27,560 | $3,990 | $23,570 |
| 2015 | $1,044 | $23,870 | $3,990 | $19,880 |
| 2014 | $1,044 | $23,870 | $3,990 | $19,880 |
| 2012 | $1,036 | $23,470 | $3,990 | $19,480 |
Source: Public Records
Map
Nearby Homes
- 1109 Park St
- 420 1st St
- 804 6th St
- 1006 Selby St
- 817 Park St
- 1011 Stall Dr
- 123 Glendale Ave
- 1008 Eastview Dr
- 202 Hancock St
- 820 Selby St
- 1109 Brookside Dr
- 829 Maple Ave
- 1727 Washington Ave
- 15591 Canadian Way
- 15586 Canadian Way
- 15615 Canadian Way
- 1200 5th St
- 211 Fairlawn Place
- 1621 S Main St
- 1301 Fishlock Ave
- 1131 S Blanchard St
- 1121 S Blanchard St
- 1117 S Blanchard St
- 614 3rd St
- 1120 Linden Ave
- 1115 S Blanchard St
- 1126 S Blanchard St
- 1130 S Blanchard St
- 1118 S Blanchard St
- 1205 S Blanchard St
- 1112 Linden Ave
- 625 3rd St
- 1202 S Blanchard St
- 1105 S Blanchard St
- 1114 S Blanchard St
- 1211 S Blanchard St
- 637 2nd St
- 1206 S Blanchard St
- 1210 S Blanchard St
- 1101 S Blanchard St