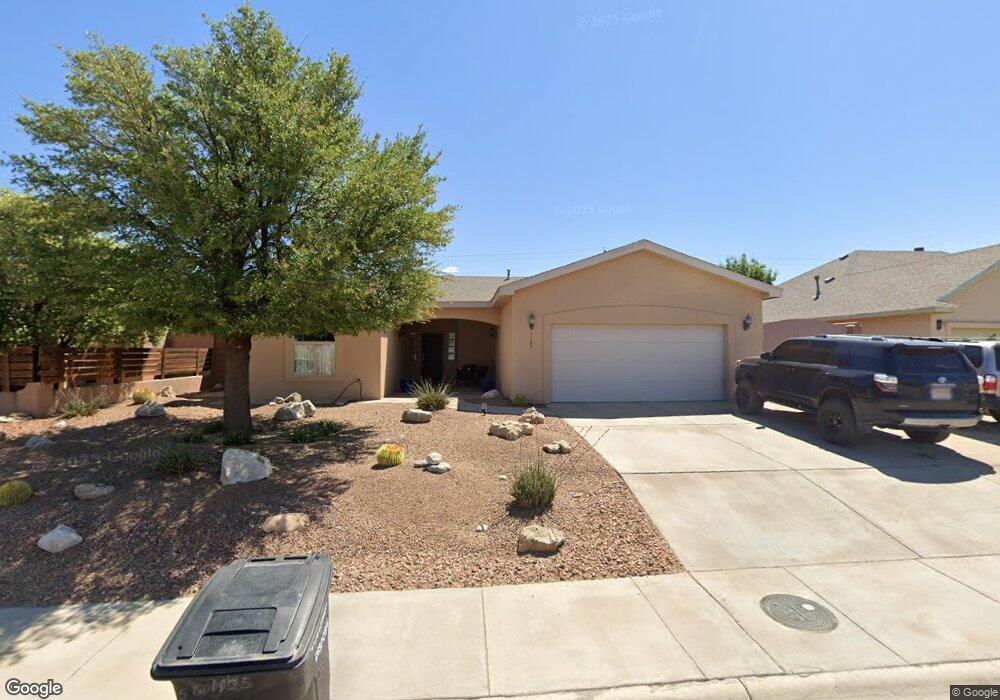
1125 Santiago St Alamogordo, NM 88310
Estimated Value: $319,000 - $356,000
3
Beds
2
Baths
1,943
Sq Ft
$173/Sq Ft
Est. Value
About This Home
This home is located at 1125 Santiago St, Alamogordo, NM 88310 and is currently estimated at $335,858, approximately $172 per square foot. 1125 Santiago St is a home located in Otero County with nearby schools including Yucca Elementary School, Desert Star Elementary School, and Mountain View Middle School.
Ownership History
Date
Name
Owned For
Owner Type
Purchase Details
Closed on
Sep 24, 2015
Sold by
Johnson William C and Johnson Dava Winsett
Bought by
Johnson William C and Johnson Winsett Johnson
Current Estimated Value
Purchase Details
Closed on
Mar 22, 2010
Sold by
Asbury William L
Bought by
Johnson William Charles and Johnson Dava Winsett
Home Financials for this Owner
Home Financials are based on the most recent Mortgage that was taken out on this home.
Original Mortgage
$230,375
Outstanding Balance
$152,306
Interest Rate
4.93%
Mortgage Type
New Conventional
Estimated Equity
$183,552
Purchase Details
Closed on
Mar 4, 2009
Sold by
Quail Hollow Llc
Bought by
Asbury William L
Home Financials for this Owner
Home Financials are based on the most recent Mortgage that was taken out on this home.
Original Mortgage
$185,553
Interest Rate
8%
Mortgage Type
Construction
Create a Home Valuation Report for This Property
The Home Valuation Report is an in-depth analysis detailing your home's value as well as a comparison with similar homes in the area
Home Values in the Area
Average Home Value in this Area
Purchase History
| Date | Buyer | Sale Price | Title Company |
|---|---|---|---|
| Johnson William C | -- | None Available | |
| Johnson William Charles | -- | None Available | |
| Asbury William L | -- | None Available |
Source: Public Records
Mortgage History
| Date | Status | Borrower | Loan Amount |
|---|---|---|---|
| Open | Johnson William Charles | $230,375 | |
| Previous Owner | Asbury William L | $185,553 |
Source: Public Records
Tax History Compared to Growth
Tax History
| Year | Tax Paid | Tax Assessment Tax Assessment Total Assessment is a certain percentage of the fair market value that is determined by local assessors to be the total taxable value of land and additions on the property. | Land | Improvement |
|---|---|---|---|---|
| 2025 | $2,587 | $101,367 | $12,107 | $89,260 |
| 2024 | $2,499 | $98,415 | $12,056 | $86,359 |
| 2023 | $2,469 | $95,548 | $12,000 | $83,548 |
| 2022 | $2,415 | $92,766 | $12,000 | $80,766 |
| 2021 | $2,443 | $92,735 | $10,817 | $81,918 |
| 2020 | $2,443 | $92,735 | $10,817 | $81,918 |
| 2019 | $2,410 | $90,917 | $10,605 | $80,312 |
| 2018 | $2,345 | $90,017 | $10,823 | $79,185 |
| 2017 | $2,158 | $88,252 | $10,611 | $77,632 |
| 2016 | $2,100 | $86,522 | $0 | $0 |
| 2015 | $2,058 | $84,825 | $0 | $0 |
| 2014 | $2,087 | $83,152 | $9,990 | $73,162 |
Source: Public Records
Map
Nearby Homes
- 1076 San Cristo St
- 1113 San Miguel
- 1120 San Carlos St
- 1240 San Carlos St
- 1336 Santiago St
- 43 Rose Ave Unit 18-20
- 1300 Ocotillo Dr
- 713 Montwood Ct
- 814 Larkspur St
- 1653 Ocotillo Dr
- 1851 Las Piedras Ct
- 761 Candlewood Ct
- 510 Plainview Dr
- 802 1/2 Larkspur St
- 857 Valencia
- 607 Coronado Dr
- 1513 Puesta Del Sol Unit 2
- 1200 S Florida Ave
- 1210 S Florida Ave
- 309 Santa fe Dr
- 1115 Santiago St
- 1135 Santiago St
- 1145 Santiago St
- 1105 Santiago St
- 1154 Pajarito Dr
- 1163 Pajarito Dr
- 1155 Santiago St
- 1155 La Bajada Dr
- 1144 Pajarito Dr
- 1153 Pajarito Dr
- 1202 Mimosa Ave
- 1212 Mimosa Ave
- 1018 La Puerta
- 1162 Mimosa Ave
- 1145 La Bajada Dr
- 1143 Pajarito Dr
- 1134 Pajarito Dr
- 1152 Mimosa Ave
- 1165 Santiago St
- 1205 Santiago St