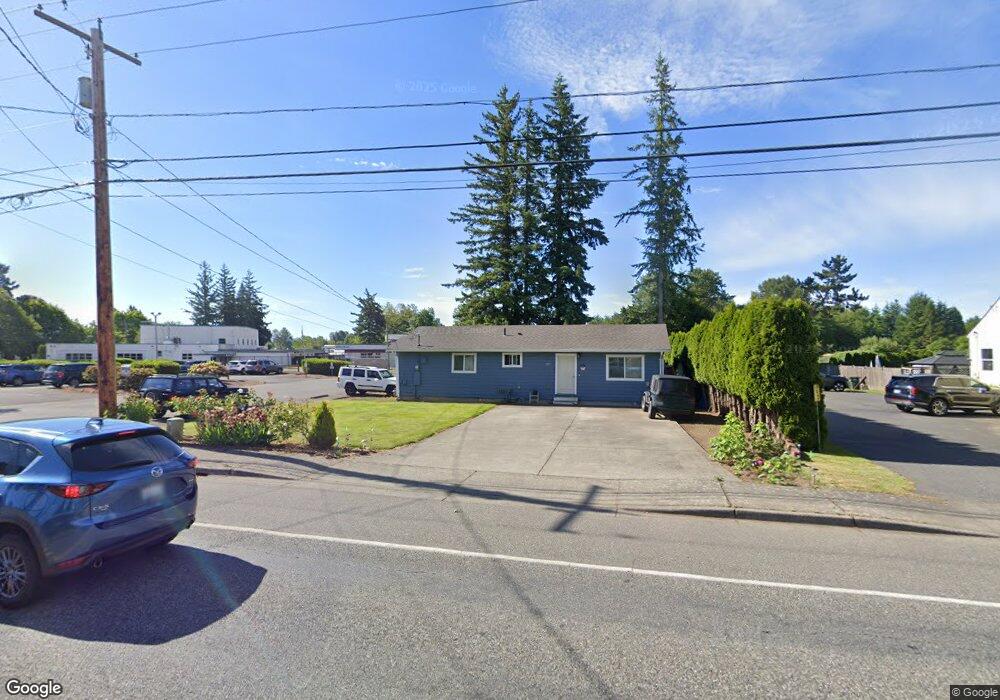
1125 W Smith Rd Bellingham, WA 98226
Estimated Value: $386,000 - $504,000
3
Beds
1
Bath
1,104
Sq Ft
$413/Sq Ft
Est. Value
About This Home
This home is located at 1125 W Smith Rd, Bellingham, WA 98226 and is currently estimated at $455,648, approximately $412 per square foot. 1125 W Smith Rd is a home located in Whatcom County with nearby schools including Central Elementary School, Vista Middle School, and Ferndale High School.
Ownership History
Date
Name
Owned For
Owner Type
Purchase Details
Closed on
Feb 25, 2010
Sold by
Hinkleman Mark D and Hinkleman Jennifer L
Bought by
Contreras Viera Jose A and Contreras Olga S
Current Estimated Value
Home Financials for this Owner
Home Financials are based on the most recent Mortgage that was taken out on this home.
Original Mortgage
$176,641
Outstanding Balance
$116,429
Interest Rate
4.87%
Mortgage Type
FHA
Estimated Equity
$339,219
Purchase Details
Closed on
Feb 12, 2004
Sold by
Rasmussen David L
Bought by
Hinkleman Mark D and Hinkleman Jennifer L
Home Financials for this Owner
Home Financials are based on the most recent Mortgage that was taken out on this home.
Original Mortgage
$128,583
Interest Rate
5.85%
Mortgage Type
FHA
Purchase Details
Closed on
Dec 3, 1998
Sold by
Rasmussen David L and Rasmussen Jami D
Bought by
Rasmussen David L
Create a Home Valuation Report for This Property
The Home Valuation Report is an in-depth analysis detailing your home's value as well as a comparison with similar homes in the area
Home Values in the Area
Average Home Value in this Area
Purchase History
| Date | Buyer | Sale Price | Title Company |
|---|---|---|---|
| Contreras Viera Jose A | $180,180 | Stewart Title Company | |
| Hinkleman Mark D | $112,085 | First American Title Ins | |
| Rasmussen David L | -- | First American Title Ins Co |
Source: Public Records
Mortgage History
| Date | Status | Borrower | Loan Amount |
|---|---|---|---|
| Open | Contreras Viera Jose A | $176,641 | |
| Previous Owner | Hinkleman Mark D | $128,583 |
Source: Public Records
Tax History Compared to Growth
Tax History
| Year | Tax Paid | Tax Assessment Tax Assessment Total Assessment is a certain percentage of the fair market value that is determined by local assessors to be the total taxable value of land and additions on the property. | Land | Improvement |
|---|---|---|---|---|
| 2024 | $2,706 | $361,163 | $198,608 | $162,555 |
| 2023 | $2,706 | $381,303 | $225,000 | $156,303 |
| 2022 | $2,453 | $323,632 | $148,834 | $174,798 |
| 2021 | $2,476 | $267,464 | $123,003 | $144,461 |
| 2020 | $2,384 | $247,658 | $113,895 | $133,763 |
| 2019 | $1,899 | $215,703 | $99,199 | $116,504 |
| 2018 | $2,178 | $197,211 | $90,695 | $106,516 |
| 2017 | $1,705 | $172,825 | $79,480 | $93,345 |
| 2016 | $1,609 | $144,781 | $71,656 | $73,125 |
| 2015 | $1,619 | $136,467 | $67,841 | $68,626 |
| 2014 | -- | $133,582 | $66,300 | $67,282 |
| 2013 | -- | $131,550 | $65,000 | $66,550 |
Source: Public Records
Map
Nearby Homes
- 5502 Northwest Dr
- 1378 W Smith Rd
- 1396 Woods Point Loop
- 5324 Shields Rd
- 794 W Smith Rd
- 4958 Pacific Hwy
- 5094 Labounty Rd
- 1245 W Axton Rd
- 0 W Axton Rd
- 5162 Spoonbill Ln
- 1371 W Axton Rd
- 1474 Sunset Ave
- 5545 La Bounty Dr
- 1300 W Axton Rd
- 5391 La Bounty Dr
- 5400 Barrett Rd
- 5330 Barret Rd S
- 0 Labounty Unit 1968051
- 1625 Main St Unit 11
- 1655 Main St
- 1131 W Smith Rd
- 1122 W Smith Rd
- 1130 W Smith Rd
- 1145 W Smith Rd
- 5305 Northwest Dr
- 1118 W Smith Rd
- 1136 W Smith Rd
- 5317 Northwest Dr
- 1153 W Smith Rd
- 1138 W Smith Rd
- 5323 Northwest Dr
- 1156 W Smith Rd
- 1157 W Smith Rd
- 5335 Northwest Dr
- 1159 W Smith Rd
- 1166 W Smith Rd
- 1171 W Smith Rd
- 5318 Northwest Dr
- 5280 Northwest Dr
- 1158 W Smith Rd