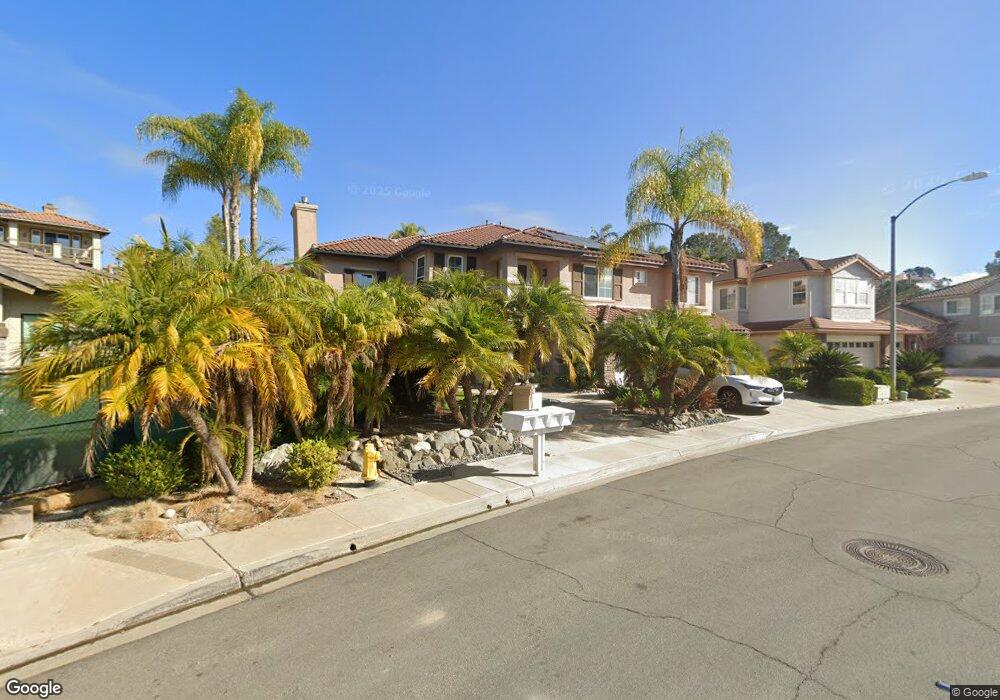
11250 Montaubon Way San Diego, CA 92131
Miramar Ranch North NeighborhoodEstimated Value: $2,377,000 - $2,892,000
5
Beds
4
Baths
4,035
Sq Ft
$634/Sq Ft
Est. Value
About This Home
This home is located at 11250 Montaubon Way, San Diego, CA 92131 and is currently estimated at $2,559,717, approximately $634 per square foot. 11250 Montaubon Way is a home located in San Diego County with nearby schools including Dingeman Elementary School, Thurgood Marshall Middle School, and Scripps Ranch High School.
Ownership History
Date
Name
Owned For
Owner Type
Purchase Details
Closed on
Feb 18, 2011
Sold by
Kalinsky Stephen Gregory and Kalinsky Jacquelyn Rachelle
Bought by
Nygaard Richard L and Nygaard June
Current Estimated Value
Purchase Details
Closed on
Jan 25, 2007
Sold by
Olia Marnie and Means Marnie
Bought by
Kalinsky Stephen Gregory and Kalinsky Jacquelyn Rachelle
Home Financials for this Owner
Home Financials are based on the most recent Mortgage that was taken out on this home.
Original Mortgage
$132,300
Interest Rate
6.29%
Mortgage Type
Stand Alone Second
Purchase Details
Closed on
Oct 22, 2003
Sold by
Means D Douglas and Means Marnie
Bought by
Means Marnie
Home Financials for this Owner
Home Financials are based on the most recent Mortgage that was taken out on this home.
Original Mortgage
$470,000
Interest Rate
7.99%
Mortgage Type
Purchase Money Mortgage
Purchase Details
Closed on
Nov 12, 1996
Sold by
L & W Investments Inc
Bought by
Means D Douglas and Means Marnie
Home Financials for this Owner
Home Financials are based on the most recent Mortgage that was taken out on this home.
Original Mortgage
$435,350
Interest Rate
7.25%
Create a Home Valuation Report for This Property
The Home Valuation Report is an in-depth analysis detailing your home's value as well as a comparison with similar homes in the area
Home Values in the Area
Average Home Value in this Area
Purchase History
| Date | Buyer | Sale Price | Title Company |
|---|---|---|---|
| Nygaard Richard L | $1,105,000 | Chicago Title Co | |
| Kalinsky Stephen Gregory | $1,325,000 | First American Title | |
| Olia Marnie | -- | First American Title | |
| Means Marnie | -- | Fidelity National Title Co | |
| Means D Douglas | $544,500 | First American Title |
Source: Public Records
Mortgage History
| Date | Status | Borrower | Loan Amount |
|---|---|---|---|
| Previous Owner | Olia Marnie | $132,300 | |
| Previous Owner | Kalinsky Stephen Gregory | $1,060,000 | |
| Previous Owner | Means Marnie | $470,000 | |
| Previous Owner | Means D Douglas | $435,350 |
Source: Public Records
Tax History Compared to Growth
Tax History
| Year | Tax Paid | Tax Assessment Tax Assessment Total Assessment is a certain percentage of the fair market value that is determined by local assessors to be the total taxable value of land and additions on the property. | Land | Improvement |
|---|---|---|---|---|
| 2025 | $17,377 | $1,415,688 | $896,818 | $518,870 |
| 2024 | $17,377 | $1,387,931 | $879,234 | $508,697 |
| 2023 | $16,983 | $1,360,718 | $861,995 | $498,723 |
| 2022 | $16,467 | $1,334,039 | $845,094 | $488,945 |
| 2021 | $16,340 | $1,307,882 | $828,524 | $479,358 |
| 2020 | $16,145 | $1,294,472 | $820,029 | $474,443 |
| 2019 | $16,512 | $1,269,091 | $803,950 | $465,141 |
| 2018 | $16,961 | $1,244,208 | $788,187 | $456,021 |
| 2017 | $16,638 | $1,219,813 | $772,733 | $447,080 |
| 2016 | $16,415 | $1,195,896 | $757,582 | $438,314 |
| 2015 | $16,207 | $1,177,934 | $746,203 | $431,731 |
| 2014 | $15,969 | $1,154,860 | $731,586 | $423,274 |
Source: Public Records
Map
Nearby Homes
- 10941 Waterton Rd
- 10616 Falcon Rim Point
- 10415 Mesa Madera Dr
- 10818 Caminito Arcada
- 10535 Arbor Park Place
- 11793 Alderhill Terrace
- 10405 White Birch Dr
- 10473 Crosscreek Terrace
- 10466 Ridgewater Ln
- 11629 Swan Lake Dr Unit 4
- 11954 Cypress Valley Dr
- 12026 Medoc Ln
- 11825 Miro Cir
- 11856 Miro Cir
- 10914 Ivy Hill Dr Unit 1
- 11495 Cypress Canyon Rd
- 11646 La Colina Rd
- 10265 Aviary Dr
- 11787 La Colina Rd
- 11466 Tree Hollow Ln
- 11246 Montaubon Way
- 11260 Montaubon Way
- 11249 Sherrard Way
- 11233 Sherrard Way
- 11261 Sherrard Way
- 11230 Montaubon Way
- 11270 Montaubon Way
- 11215 Sherrard Way
- 11275 Sherrard Way
- 11095 Montaubon Cir
- 11198 Montaubon Way
- 11085 Montaubon Cir Unit 13
- 11205 Sherrard Way
- 11248 Sherrard Way
- 11236 Sherrard Way
- 11256 Sherrard Way
- 11224 Sherrard Way
- 11055 Montaubon Cir
- 11268 Sherrard Way
- 11075 Montaubon Cir