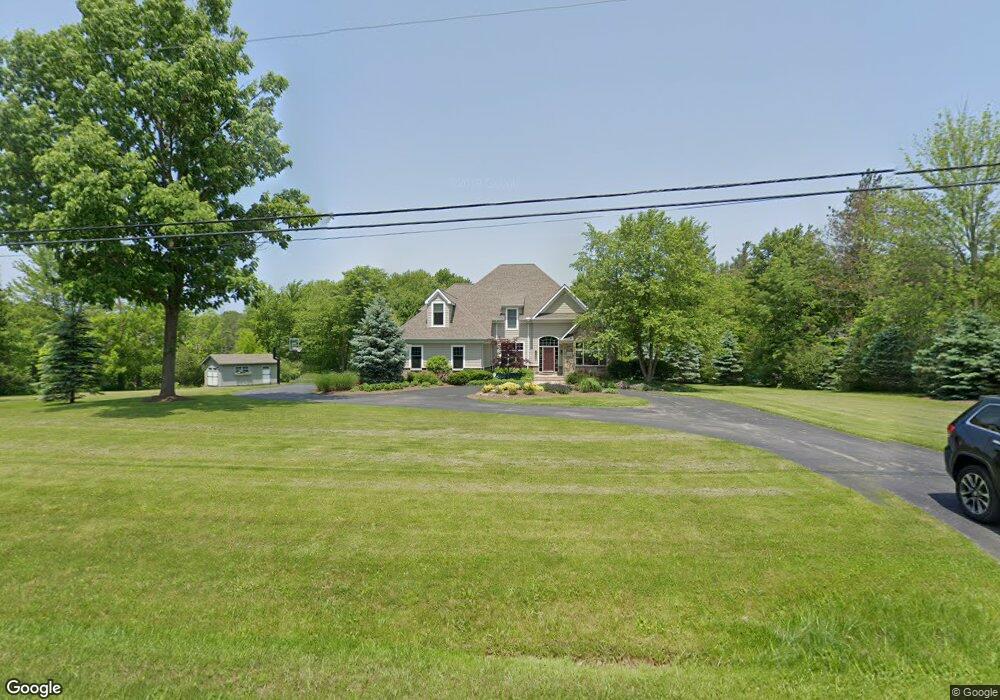
11250 Sherman Rd Chardon, OH 44024
Estimated Value: $582,000 - $631,000
4
Beds
3
Baths
2,925
Sq Ft
$207/Sq Ft
Est. Value
About This Home
This home is located at 11250 Sherman Rd, Chardon, OH 44024 and is currently estimated at $605,874, approximately $207 per square foot. 11250 Sherman Rd is a home located in Geauga County with nearby schools including Chardon High School and Notre Dame Elementary School.
Ownership History
Date
Name
Owned For
Owner Type
Purchase Details
Closed on
Nov 16, 2015
Sold by
Enright Michael J and Enright Jill A
Bought by
The Enright Family Revocable Trust and Enright Jill A
Current Estimated Value
Purchase Details
Closed on
Aug 17, 2005
Sold by
Intihar Brian M
Bought by
Enright Michael J and Enright Jill A
Home Financials for this Owner
Home Financials are based on the most recent Mortgage that was taken out on this home.
Original Mortgage
$184,000
Outstanding Balance
$96,844
Interest Rate
5.69%
Mortgage Type
Purchase Money Mortgage
Estimated Equity
$509,030
Purchase Details
Closed on
Apr 2, 2004
Sold by
The Burlington Group Inc
Bought by
Intihar Brian M
Home Financials for this Owner
Home Financials are based on the most recent Mortgage that was taken out on this home.
Original Mortgage
$275,000
Interest Rate
4%
Mortgage Type
Construction
Create a Home Valuation Report for This Property
The Home Valuation Report is an in-depth analysis detailing your home's value as well as a comparison with similar homes in the area
Home Values in the Area
Average Home Value in this Area
Purchase History
| Date | Buyer | Sale Price | Title Company |
|---|---|---|---|
| The Enright Family Revocable Trust | -- | Attorney | |
| Enright Michael J | -- | None Available | |
| Intihar Brian M | $90,000 | Geauga Title Insurance |
Source: Public Records
Mortgage History
| Date | Status | Borrower | Loan Amount |
|---|---|---|---|
| Open | Enright Michael J | $184,000 | |
| Previous Owner | Intihar Brian M | $275,000 |
Source: Public Records
Tax History Compared to Growth
Tax History
| Year | Tax Paid | Tax Assessment Tax Assessment Total Assessment is a certain percentage of the fair market value that is determined by local assessors to be the total taxable value of land and additions on the property. | Land | Improvement |
|---|---|---|---|---|
| 2024 | $8,395 | $171,750 | $37,840 | $133,910 |
| 2023 | $8,395 | $171,750 | $37,840 | $133,910 |
| 2022 | $7,662 | $134,680 | $31,570 | $103,110 |
| 2021 | $7,627 | $134,680 | $31,570 | $103,110 |
| 2020 | $7,684 | $134,680 | $31,570 | $103,110 |
| 2019 | $697 | $120,470 | $31,570 | $88,900 |
| 2018 | $7,439 | $120,470 | $31,570 | $88,900 |
| 2017 | $6,967 | $120,470 | $31,570 | $88,900 |
| 2016 | $7,056 | $119,040 | $31,570 | $87,470 |
| 2015 | $6,793 | $119,040 | $31,570 | $87,470 |
| 2014 | $6,793 | $119,040 | $31,570 | $87,470 |
| 2013 | $6,837 | $119,040 | $31,570 | $87,470 |
Source: Public Records
Map
Nearby Homes
- 12386 Auburn Rd
- 11955 Fowlers Mill Rd
- 10970 Wood Hollow Dr
- 11524 Lakeview Rd
- 11571 Basswood Rd
- 11430 Parkside Rd
- 11375 Bean Rd
- 10891 Nollwood Dr
- 10571 Mayfield Rd
- 0 Fowlers Mill Rd Unit 5140846
- 13044 Coachman Dr
- 11440 Woodiebrook Rd
- 0 Waterfowl Ln Unit 5159838
- S/L 19 Sutton Place
- 13190 N Bridle Trail
- 11610 Pinehurst Dr
- 11785 Stonegate Dr
- 10504 Mulberry Rd
- 11637 Ravenna Rd
- 13410 Auburn Rd
- 11270 Sherman Rd
- 11230 Sherman Rd
- 11251 Sherman Rd
- 11210 Sherman Rd
- 12222 Falls Rd
- 12200 Falls Rd
- 12150 Falls Rd
- 12180 Falls Rd
- V/L22 Trail 1003
- 12160 Falls Rd
- S/L 7 S/L Trail 1003
- 12130 Falls Rd
- 11155 Sherman Rd
- 12205 Falls Rd
- 12185 Falls Rd
- 11130 Sherman Rd
- 11360 Sherman Rd
- S/L 7 Falls Rd
- 12160 Quartermane Cir
- 12125 Falls Rd