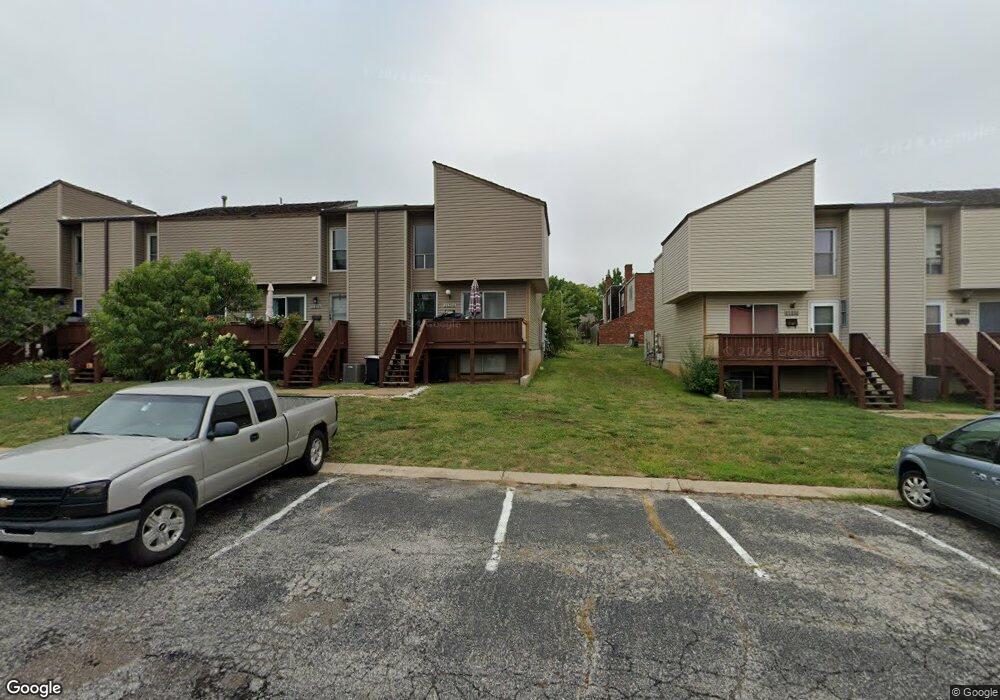
11254 College Ave Kansas City, MO 64137
Calico Farms NeighborhoodEstimated Value: $115,000 - $146,853
3
Beds
3
Baths
1,390
Sq Ft
$93/Sq Ft
Est. Value
About This Home
This home is located at 11254 College Ave, Kansas City, MO 64137 and is currently estimated at $129,713, approximately $93 per square foot. 11254 College Ave is a home located in Jackson County with nearby schools including Warford Elementary School, Ruskin High School, and Alpha Montessori School.
Ownership History
Date
Name
Owned For
Owner Type
Purchase Details
Closed on
Jan 31, 2024
Sold by
Calico Homes Llc
Bought by
Jolly & Associates Llc
Current Estimated Value
Home Financials for this Owner
Home Financials are based on the most recent Mortgage that was taken out on this home.
Original Mortgage
$386,437
Outstanding Balance
$379,608
Interest Rate
6.61%
Mortgage Type
Credit Line Revolving
Estimated Equity
-$249,895
Purchase Details
Closed on
Mar 7, 2013
Sold by
Boudreaux Robert
Bought by
Calico Homes Llc
Home Financials for this Owner
Home Financials are based on the most recent Mortgage that was taken out on this home.
Original Mortgage
$43,200
Interest Rate
3.44%
Mortgage Type
Future Advance Clause Open End Mortgage
Purchase Details
Closed on
Sep 26, 2012
Sold by
Rohrer Properties Inc
Bought by
Boudreaux Robert
Purchase Details
Closed on
Feb 4, 2008
Sold by
Rohrer James P and Rohrer Lori A
Bought by
Rohrer Properties Inc
Create a Home Valuation Report for This Property
The Home Valuation Report is an in-depth analysis detailing your home's value as well as a comparison with similar homes in the area
Home Values in the Area
Average Home Value in this Area
Purchase History
| Date | Buyer | Sale Price | Title Company |
|---|---|---|---|
| Jolly & Associates Llc | -- | Security 1St Title | |
| Calico Homes Llc | -- | Midwest Title Company Inc | |
| Boudreaux Robert | -- | Secured Title Of Kansas City | |
| Rohrer Properties Inc | -- | None Available |
Source: Public Records
Mortgage History
| Date | Status | Borrower | Loan Amount |
|---|---|---|---|
| Open | Jolly & Associates Llc | $386,437 | |
| Previous Owner | Calico Homes Llc | $43,200 |
Source: Public Records
Tax History Compared to Growth
Tax History
| Year | Tax Paid | Tax Assessment Tax Assessment Total Assessment is a certain percentage of the fair market value that is determined by local assessors to be the total taxable value of land and additions on the property. | Land | Improvement |
|---|---|---|---|---|
| 2025 | $1,454 | $17,839 | $2,339 | $15,500 |
| 2024 | $1,454 | $16,794 | $716 | $16,078 |
| 2023 | $1,428 | $16,794 | $1,402 | $15,392 |
| 2022 | $1,336 | $13,490 | $703 | $12,787 |
| 2021 | $1,152 | $13,490 | $703 | $12,787 |
| 2020 | $1,064 | $11,780 | $703 | $11,077 |
| 2019 | $1,239 | $14,499 | $703 | $13,796 |
| 2018 | $973 | $10,631 | $1,036 | $9,595 |
| 2017 | $973 | $10,631 | $1,036 | $9,595 |
| 2016 | $977 | $10,365 | $783 | $9,582 |
| 2014 | $966 | $10,365 | $783 | $9,582 |
Source: Public Records
Map
Nearby Homes
- 3316 Bridge Manor Dr
- 11337 Calico Dr
- 11105 Askew Ave
- 11213 Myrtle Ave
- 2517 Red Bridge Terrace
- 4100 E 112th St
- 10905 Bales Ave
- 2404 E Red Bridge Rd
- 4016 E Red Bridge Rd
- 10912 Myrtle Ave
- 10806 Grandview Rd
- 10630 Walrond Ave
- 4206 E 115th St
- 10634 College Ave
- 2900 E 119th St
- 4509 E 113th St
- 3301 E 106th Terrace
- 4510 E 113th St
- 4510 E 112 St
- 4604 E 114th Terrace
- 11256 College Ave
- 11252 College Ave
- 11258 College Ave
- 11250 College Ave
- 11260 College Ave
- 11253 Calico Dr
- 11261 Calico Dr
- 11248 College Ave
- 11251 Calico Dr
- 11246 College Ave
- 11266 College Ave
- 11259 Calico Dr
- 11249 Calico Dr
- 11257 Calico Dr
- 11262 College Ave
- 11244 College Ave
- 11255 Calico Dr
- 11268 College Ave
- 11242 College Ave
- 11264 College Ave