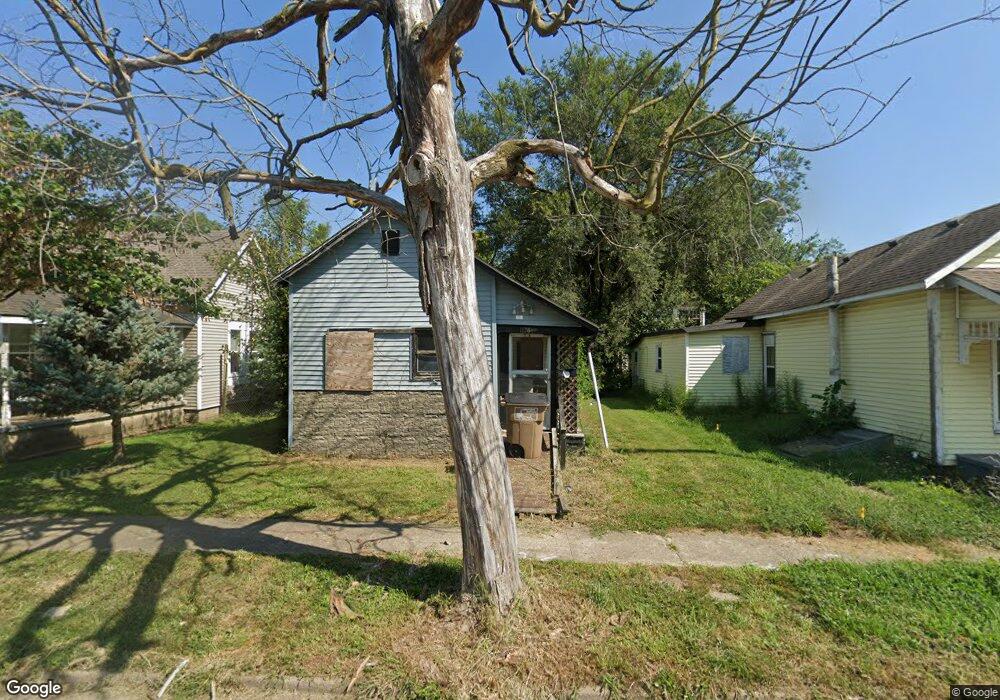
1126 9th St Columbus, IN 47201
Estimated Value: $69,483 - $131,000
1
Bed
1
Bath
652
Sq Ft
$171/Sq Ft
Est. Value
About This Home
This home is located at 1126 9th St, Columbus, IN 47201 and is currently estimated at $111,621, approximately $171 per square foot. 1126 9th St is a home located in Bartholomew County with nearby schools including Lillian Schmitt Elementary School, Central Middle School, and Columbus North High School.
Ownership History
Date
Name
Owned For
Owner Type
Purchase Details
Closed on
Jul 14, 2022
Sold by
Maxwell Shannon D
Bought by
Columbus Homes For Rent Llc
Current Estimated Value
Purchase Details
Closed on
Sep 21, 2018
Sold by
Harbour Portfolio 7 Lp
Bought by
Us Bank Na
Purchase Details
Closed on
Dec 27, 2011
Sold by
Federal National Mortgage Association
Bought by
Harbour Portfolio Vii Lp
Purchase Details
Closed on
Jul 12, 2011
Sold by
Not Provided
Bought by
Not Provided
Purchase Details
Closed on
Nov 26, 2007
Sold by
Edwards Buddie
Bought by
Edwards Harold J
Create a Home Valuation Report for This Property
The Home Valuation Report is an in-depth analysis detailing your home's value as well as a comparison with similar homes in the area
Home Values in the Area
Average Home Value in this Area
Purchase History
| Date | Buyer | Sale Price | Title Company |
|---|---|---|---|
| Columbus Homes For Rent Llc | $31,725 | Meridian Title Corporation | |
| Maxwell Shannon D | $31,725 | Meridian Title Corporation | |
| Us Bank Na | -- | -- | |
| Harbour Portfolio Vii Lp | $351 | -- | |
| Harbour Portfolio Vii Lp | $351 | -- | |
| Not Provided | $351 | -- | |
| Federal National Mortgage Association | $29,902 | -- | |
| Edwards Harold J | -- | None Available |
Source: Public Records
Tax History
| Year | Tax Paid | Tax Assessment Tax Assessment Total Assessment is a certain percentage of the fair market value that is determined by local assessors to be the total taxable value of land and additions on the property. | Land | Improvement |
|---|---|---|---|---|
| 2025 | $528 | $23,700 | $19,700 | $4,000 |
| 2024 | $533 | $23,500 | $19,700 | $3,800 |
| 2023 | $533 | $23,400 | $19,700 | $3,700 |
| 2022 | $1,519 | $67,000 | $19,700 | $47,300 |
| 2021 | $1,206 | $52,700 | $10,500 | $42,200 |
| 2020 | $675 | $29,500 | $10,500 | $19,000 |
| 2019 | $1,274 | $28,100 | $10,500 | $17,600 |
| 2018 | $713 | $28,100 | $10,500 | $17,600 |
| 2017 | $616 | $28,200 | $10,500 | $17,700 |
| 2016 | $618 | $28,200 | $10,500 | $17,700 |
| 2014 | $628 | $28,200 | $10,500 | $17,700 |
Source: Public Records
Map
Nearby Homes
Your Personal Tour Guide
Ask me questions while you tour the home.