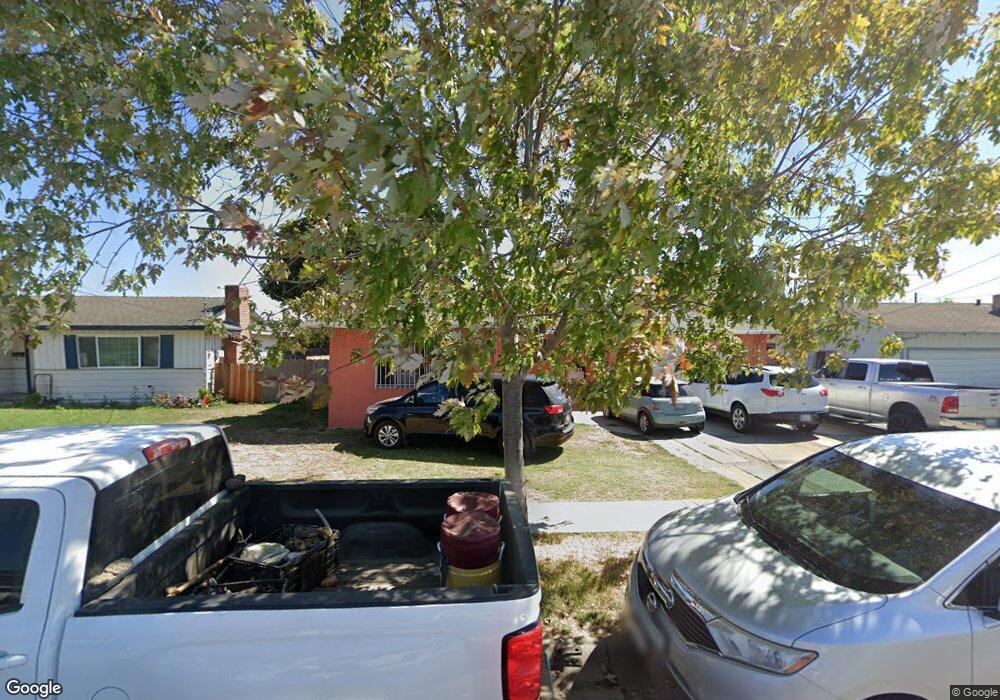
1126 Atlantic St Salinas, CA 93905
East Salinas NeighborhoodEstimated Value: $573,000 - $705,000
3
Beds
2
Baths
1,726
Sq Ft
$368/Sq Ft
Est. Value
About This Home
This home is located at 1126 Atlantic St, Salinas, CA 93905 and is currently estimated at $635,095, approximately $367 per square foot. 1126 Atlantic St is a home located in Monterey County with nearby schools including Virginia Rocca Barton Elementary School, La Paz Middle School, and Alisal High School.
Ownership History
Date
Name
Owned For
Owner Type
Purchase Details
Closed on
Nov 9, 2019
Sold by
Nunez Luzmila
Bought by
Nunez Luzmila and Nunez Family Trust
Current Estimated Value
Purchase Details
Closed on
Aug 29, 2007
Sold by
Nunez Elias H and Nunez Luzmila S
Bought by
Nunez Elias and Nunez Luzmila
Home Financials for this Owner
Home Financials are based on the most recent Mortgage that was taken out on this home.
Original Mortgage
$399,000
Interest Rate
6.67%
Mortgage Type
New Conventional
Create a Home Valuation Report for This Property
The Home Valuation Report is an in-depth analysis detailing your home's value as well as a comparison with similar homes in the area
Home Values in the Area
Average Home Value in this Area
Purchase History
| Date | Buyer | Sale Price | Title Company |
|---|---|---|---|
| Nunez Luzmila | -- | None Available | |
| Nunez Elias | -- | Chicago Title Co |
Source: Public Records
Mortgage History
| Date | Status | Borrower | Loan Amount |
|---|---|---|---|
| Closed | Nunez Elias | $399,000 |
Source: Public Records
Tax History
| Year | Tax Paid | Tax Assessment Tax Assessment Total Assessment is a certain percentage of the fair market value that is determined by local assessors to be the total taxable value of land and additions on the property. | Land | Improvement |
|---|---|---|---|---|
| 2025 | $3,239 | $244,906 | $114,937 | $129,969 |
| 2024 | $3,239 | $240,105 | $112,684 | $127,421 |
| 2023 | $3,180 | $235,398 | $110,475 | $124,923 |
| 2022 | $3,408 | $230,783 | $108,309 | $122,474 |
| 2021 | $3,314 | $226,259 | $106,186 | $120,073 |
| 2020 | $3,288 | $223,940 | $105,098 | $118,842 |
| 2019 | $3,337 | $219,550 | $103,038 | $116,512 |
| 2018 | $3,117 | $215,246 | $101,018 | $114,228 |
| 2017 | $3,033 | $211,027 | $99,038 | $111,989 |
| 2016 | $2,712 | $206,891 | $97,097 | $109,794 |
| 2015 | $2,688 | $203,784 | $95,639 | $108,145 |
| 2014 | $2,591 | $199,793 | $93,766 | $106,027 |
Source: Public Records
Map
Nearby Homes
- 755 Pino Way
- 948 Rider Ave
- 11 Fresa Place
- 1046 C St
- 933 Acosta Plaza Unit 35
- 1094 Twin Creeks Dr
- 1049 Twin Creeks Dr
- 11 E Laurel Dr
- 11 Hill Cir
- 609 Saint George Dr
- 18 Hancock Cir
- 544 Saint George Dr
- 1544 Saguaro Dr Unit 4
- 1725 Great Island St
- 11 Saguaro Cir
- 320 N Sanborn Rd
- 724 Circle Dr
- 10 Rex Cir
- 230 Paloma Ave
- 15 Cheswick Cir
Your Personal Tour Guide
Ask me questions while you tour the home.