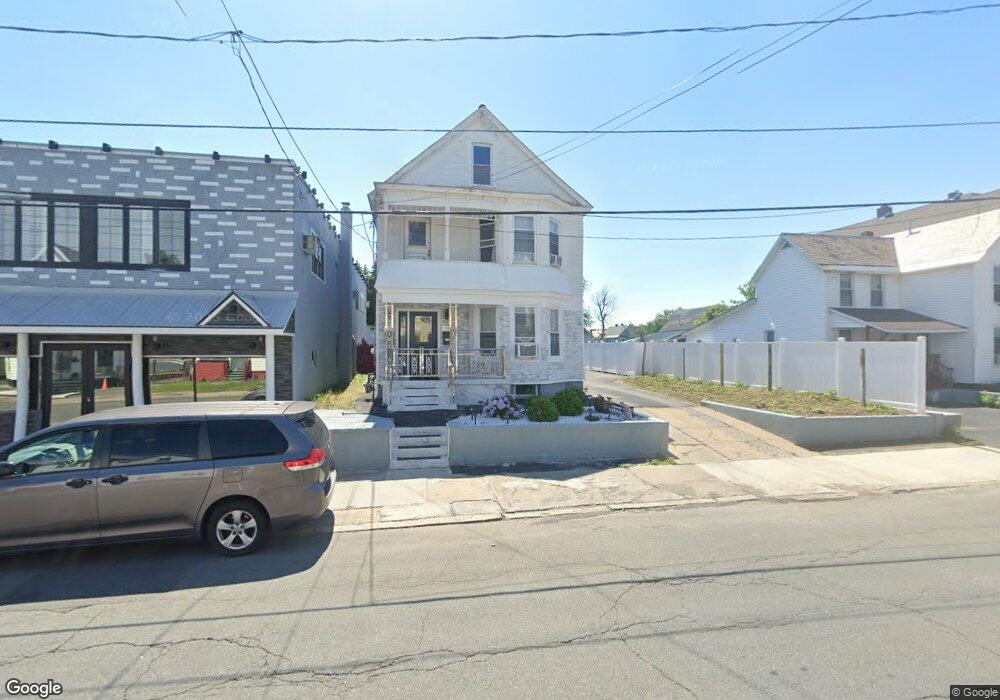
1126 Crane St Schenectady, NY 12303
Mont Pleasant NeighborhoodEstimated Value: $217,000 - $232,000
5
Beds
2
Baths
2,176
Sq Ft
$102/Sq Ft
Est. Value
About This Home
This home is located at 1126 Crane St, Schenectady, NY 12303 and is currently estimated at $221,804, approximately $101 per square foot. 1126 Crane St is a home located in Schenectady County with nearby schools including Hamilton Elementary School, Mont Pleasant Middle School, and Schenectady High School.
Ownership History
Date
Name
Owned For
Owner Type
Purchase Details
Closed on
Jan 14, 2019
Sold by
Mootooveren John and Mootooveren Chandranie
Bought by
Uttandi Suraj D and Khan Bibi S
Current Estimated Value
Home Financials for this Owner
Home Financials are based on the most recent Mortgage that was taken out on this home.
Original Mortgage
$101,998
Outstanding Balance
$90,162
Interest Rate
4.87%
Mortgage Type
FHA
Estimated Equity
$131,642
Purchase Details
Closed on
Feb 23, 2015
Sold by
Mootooveren Veramootoo
Bought by
Mootooveren John
Purchase Details
Closed on
Feb 22, 2015
Sold by
Mootooveren Veramootoo and Mootooveren Chandranie
Bought by
Mootooveren John and Mootooveren Chandranie
Purchase Details
Closed on
Jan 29, 2002
Sold by
Park Sharon
Bought by
Mootooveren Veramootoo
Create a Home Valuation Report for This Property
The Home Valuation Report is an in-depth analysis detailing your home's value as well as a comparison with similar homes in the area
Home Values in the Area
Average Home Value in this Area
Purchase History
| Date | Buyer | Sale Price | Title Company |
|---|---|---|---|
| Uttandi Suraj D | $104,000 | None Available | |
| Mootooveren John | -- | -- | |
| Mootooveren John | -- | None Available | |
| Mootooveren Veramootoo | $53,350 | Stanley Skubis |
Source: Public Records
Mortgage History
| Date | Status | Borrower | Loan Amount |
|---|---|---|---|
| Open | Uttandi Suraj D | $101,998 |
Source: Public Records
Tax History
| Year | Tax Paid | Tax Assessment Tax Assessment Total Assessment is a certain percentage of the fair market value that is determined by local assessors to be the total taxable value of land and additions on the property. | Land | Improvement |
|---|---|---|---|---|
| 2024 | $5,783 | $97,000 | $14,600 | $82,400 |
| 2023 | $56 | $97,000 | $14,600 | $82,400 |
| 2022 | $5,459 | $97,000 | $14,600 | $82,400 |
| 2021 | $5,416 | $97,000 | $14,600 | $82,400 |
| 2020 | $5,370 | $97,000 | $14,600 | $82,400 |
| 2019 | $3,360 | $97,000 | $14,600 | $82,400 |
| 2018 | $5,418 | $97,000 | $14,600 | $82,400 |
| 2017 | $4,662 | $97,000 | $14,600 | $82,400 |
| 2016 | $5,490 | $97,000 | $14,600 | $82,400 |
| 2015 | -- | $97,000 | $14,600 | $82,400 |
| 2014 | -- | $97,000 | $14,600 | $82,400 |
Source: Public Records
Map
Nearby Homes
Your Personal Tour Guide
Ask me questions while you tour the home.