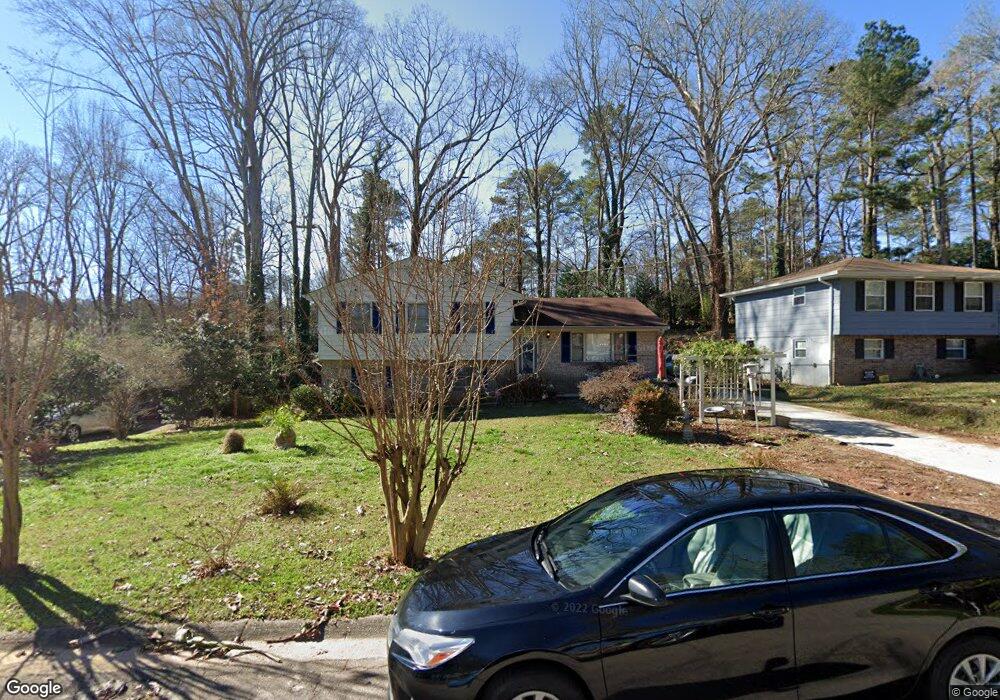
1126 De Leon Ct Unit 1 Clarkston, GA 30021
Estimated Value: $337,320 - $395,000
3
Beds
2
Baths
2,131
Sq Ft
$171/Sq Ft
Est. Value
About This Home
This home is located at 1126 De Leon Ct Unit 1, Clarkston, GA 30021 and is currently estimated at $363,830, approximately $170 per square foot. 1126 De Leon Ct Unit 1 is a home located in DeKalb County with nearby schools including McLendon Elementary School, Druid Hills Middle School, and Druid Hills High School.
Ownership History
Date
Name
Owned For
Owner Type
Purchase Details
Closed on
Jun 25, 2003
Sold by
Temnewo Tsehaie K
Bought by
Temnewo Tsehaie K
Current Estimated Value
Home Financials for this Owner
Home Financials are based on the most recent Mortgage that was taken out on this home.
Original Mortgage
$103,000
Interest Rate
5.29%
Mortgage Type
Stand Alone Second
Purchase Details
Closed on
Sep 27, 1999
Sold by
Secretary and Hud
Bought by
Temnewo Tsehaie K
Home Financials for this Owner
Home Financials are based on the most recent Mortgage that was taken out on this home.
Original Mortgage
$98,455
Interest Rate
7.91%
Mortgage Type
New Conventional
Purchase Details
Closed on
May 5, 1998
Sold by
Union Planters Bank
Bought by
Secretary and Hud
Create a Home Valuation Report for This Property
The Home Valuation Report is an in-depth analysis detailing your home's value as well as a comparison with similar homes in the area
Home Values in the Area
Average Home Value in this Area
Purchase History
| Date | Buyer | Sale Price | Title Company |
|---|---|---|---|
| Temnewo Tsehaie K | -- | -- | |
| Temnewo Tsehaie K | -- | -- | |
| Secretary | -- | -- | |
| Union Planters Bank | $75,465 | -- |
Source: Public Records
Mortgage History
| Date | Status | Borrower | Loan Amount |
|---|---|---|---|
| Closed | Temnewo Tsehaie K | $103,000 | |
| Previous Owner | Temnewo Tsehaie K | $98,455 |
Source: Public Records
Tax History Compared to Growth
Tax History
| Year | Tax Paid | Tax Assessment Tax Assessment Total Assessment is a certain percentage of the fair market value that is determined by local assessors to be the total taxable value of land and additions on the property. | Land | Improvement |
|---|---|---|---|---|
| 2025 | $3,586 | $128,600 | $31,680 | $96,920 |
| 2024 | $3,572 | $124,240 | $31,680 | $92,560 |
| 2023 | $3,572 | $117,200 | $26,520 | $90,680 |
| 2022 | $3,155 | $108,800 | $26,200 | $82,600 |
| 2021 | $2,766 | $91,920 | $26,000 | $65,920 |
| 2020 | $2,425 | $76,920 | $26,000 | $50,920 |
| 2019 | $2,308 | $72,800 | $26,000 | $46,800 |
| 2018 | $2,066 | $69,120 | $26,000 | $43,120 |
| 2017 | $1,798 | $52,360 | $17,600 | $34,760 |
| 2016 | $2,039 | $60,600 | $10,000 | $50,600 |
| 2014 | $1,164 | $35,280 | $9,360 | $25,920 |
Source: Public Records
Map
Nearby Homes
- 3295 Artesia Dr
- 1231 Sanden Ferry Dr
- 1155 Jolly Ave
- 1523 Delia Dr
- 1245 Mclendon Dr
- 3130 Dove Way
- 1269 Mclendon Dr
- 1120 Milam Cir
- 3145 Valaire Dr
- 898 Verona Dr
- 1110 Milam Cir
- 1010 Greenbriar Cir
- 3166 Lindmoor Dr
- 3068 Anthony Dr
- 848 East Ave
- 3695 Church St
- 4201 Church St
- 3637 Lincoln St
- 3813 Church St
- 2094 Brian Way
- 1132 De Leon Ct
- 1116 De Leon Ct
- 1121 De Leon Ct
- 1138 De Leon Ct
- 1127 De Leon Ct
- 1133 De Leon Ct
- 1139 De Leon Ct
- 1144 De Leon Ct
- 1107 Creekdale Dr
- 1113 Creekdale Dr
- 1115 De Leon Ct
- 1110 De Leon Ct
- 1101 Creekdale Dr
- 1119 Creekdale Dr
- 1145 De Leon Ct Unit 1
- 1152 De Leon Ct Unit 1
- 1109 De Leon Ct
- 1102 De Leon Ct
- 1095 Creekdale Dr
- 1125 Creekdale Dr Unit 1