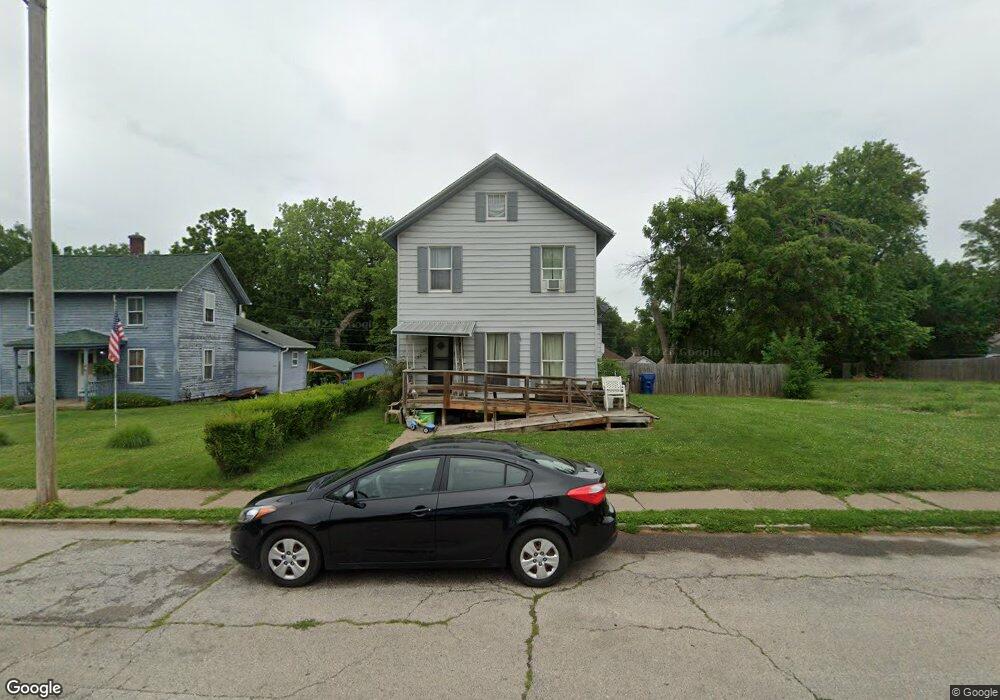
1126 E 13th St Davenport, IA 52803
East End NeighborhoodEstimated Value: $122,000 - $136,568
4
Beds
2
Baths
1,928
Sq Ft
$68/Sq Ft
Est. Value
About This Home
This home is located at 1126 E 13th St, Davenport, IA 52803 and is currently estimated at $130,642, approximately $67 per square foot. 1126 E 13th St is a home located in Scott County with nearby schools including McKinley Elementary School, Casey County Middle School, and Hopkinsville Middle School.
Ownership History
Date
Name
Owned For
Owner Type
Purchase Details
Closed on
Dec 23, 2011
Sold by
Madison Marcus I and Madisson Melissa L
Bought by
Horner Christina J
Current Estimated Value
Home Financials for this Owner
Home Financials are based on the most recent Mortgage that was taken out on this home.
Original Mortgage
$85,769
Outstanding Balance
$58,401
Interest Rate
3.99%
Mortgage Type
FHA
Estimated Equity
$72,241
Purchase Details
Closed on
Jun 19, 2006
Sold by
New Look Renovations L L C
Bought by
Madison Marcus L and Madison Melissa L
Home Financials for this Owner
Home Financials are based on the most recent Mortgage that was taken out on this home.
Original Mortgage
$76,661
Interest Rate
6.72%
Mortgage Type
New Conventional
Create a Home Valuation Report for This Property
The Home Valuation Report is an in-depth analysis detailing your home's value as well as a comparison with similar homes in the area
Home Values in the Area
Average Home Value in this Area
Purchase History
| Date | Buyer | Sale Price | Title Company |
|---|---|---|---|
| Horner Christina J | $88,000 | None Available | |
| Madison Marcus L | $80,500 | None Available |
Source: Public Records
Mortgage History
| Date | Status | Borrower | Loan Amount |
|---|---|---|---|
| Open | Horner Christina J | $85,769 | |
| Previous Owner | Madison Marcus L | $76,661 |
Source: Public Records
Tax History Compared to Growth
Tax History
| Year | Tax Paid | Tax Assessment Tax Assessment Total Assessment is a certain percentage of the fair market value that is determined by local assessors to be the total taxable value of land and additions on the property. | Land | Improvement |
|---|---|---|---|---|
| 2025 | $1,754 | $118,000 | $22,190 | $95,810 |
| 2024 | $1,708 | $108,420 | $22,190 | $86,230 |
| 2023 | $2,150 | $108,420 | $22,190 | $86,230 |
| 2022 | $2,236 | $109,490 | $10,140 | $99,350 |
| 2021 | $2,236 | $113,170 | $10,140 | $103,030 |
| 2020 | $2,138 | $98,450 | $10,140 | $88,310 |
| 2019 | $2,186 | $98,450 | $10,140 | $88,310 |
| 2018 | $2,609 | $98,450 | $10,140 | $88,310 |
| 2017 | $2,044 | $98,450 | $10,140 | $88,310 |
| 2016 | $2,653 | $98,450 | $0 | $0 |
| 2015 | $1,966 | $89,380 | $0 | $0 |
| 2014 | $1,792 | $89,380 | $0 | $0 |
| 2013 | $1,756 | $0 | $0 | $0 |
| 2012 | -- | $79,250 | $9,560 | $69,690 |
Source: Public Records
Map
Nearby Homes
- 1220 College Ave
- 1224 E 11th St
- 1501 Bridge Ave
- 1134 Tremont Ave
- 1102 College Ave
- 1012 Bridge Ave
- 1020 E 15th St
- 1004 College Ave
- 916 Kirkwood Blvd
- 1605 Arlington Ave
- 1325 Mississippi Ave
- 1616 Esplanade Ave
- 1626 Esplanade Ave
- 1202 Adams St
- 637 E 15th St
- 1215 Farnam St
- 1233 Eastern Ave
- 1920 Carey Ave
- 11 Oak Ln
- 618 Douglas Ct
- 1134 E 13th St
- 1122 E 13th St
- 1140 E 13th St
- 1114 E 13th St
- 1229 Oneida Ave
- 1146 E 13th St
- 1108 E 13th St
- 1127 E 14th St
- 1123 E 14th St
- 1129 E 14th St
- 1137 E 13th St
- 1119 E 14th St
- 1133 E 14th St
- 1115 E 14th St
- 1115 E 13th St
- 1325 Carey Ave
- 1322 Bridge Ave
- 1152 E 13th St
- 1104 E 13th St
- 1108 E 12th St