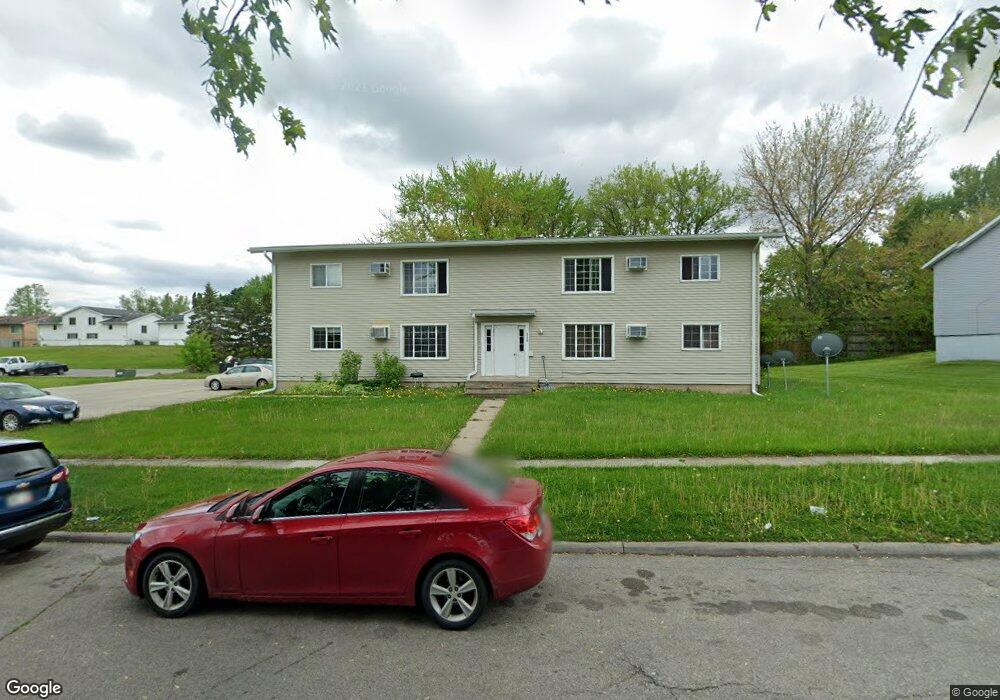
1126 Langley Rd Unit 1 Waterloo, IA 50702
Hurst NeighborhoodEstimated Value: $80,780 - $486,000
2
Beds
1
Bath
690
Sq Ft
$279/Sq Ft
Est. Value
About This Home
This home is located at 1126 Langley Rd Unit 1, Waterloo, IA 50702 and is currently estimated at $192,195, approximately $278 per square foot. 1126 Langley Rd Unit 1 is a home located in Black Hawk County with nearby schools including Kittrell Elementary School, Hoover Middle School, and West High School.
Ownership History
Date
Name
Owned For
Owner Type
Purchase Details
Closed on
Oct 25, 2024
Sold by
Dollys Rentals Llc
Bought by
K & I Properties Llc
Current Estimated Value
Home Financials for this Owner
Home Financials are based on the most recent Mortgage that was taken out on this home.
Original Mortgage
$117,980
Interest Rate
6.08%
Purchase Details
Closed on
Mar 31, 2014
Sold by
Tdj Investments Llc
Bought by
Dollys Rentals Llc
Purchase Details
Closed on
Oct 30, 2012
Sold by
Howard L Allen Investments Inc
Bought by
Tdj Investments Llc
Home Financials for this Owner
Home Financials are based on the most recent Mortgage that was taken out on this home.
Original Mortgage
$244,800
Interest Rate
3.32%
Mortgage Type
Future Advance Clause Open End Mortgage
Create a Home Valuation Report for This Property
The Home Valuation Report is an in-depth analysis detailing your home's value as well as a comparison with similar homes in the area
Home Values in the Area
Average Home Value in this Area
Purchase History
| Date | Buyer | Sale Price | Title Company |
|---|---|---|---|
| K & I Properties Llc | $590,000 | Title Services | |
| Dollys Rentals Llc | $360,000 | None Available | |
| Tdj Investments Llc | $288,000 | Black Hawk County Abstract & |
Source: Public Records
Mortgage History
| Date | Status | Borrower | Loan Amount |
|---|---|---|---|
| Closed | K & I Properties Llc | $117,980 | |
| Open | K & I Properties Llc | $442,425 | |
| Previous Owner | Tdj Investments Llc | $244,800 |
Source: Public Records
Tax History Compared to Growth
Tax History
| Year | Tax Paid | Tax Assessment Tax Assessment Total Assessment is a certain percentage of the fair market value that is determined by local assessors to be the total taxable value of land and additions on the property. | Land | Improvement |
|---|---|---|---|---|
| 2025 | $972 | $46,760 | $3,740 | $43,020 |
| 2024 | $972 | $44,800 | $3,740 | $41,060 |
| 2023 | $882 | $44,800 | $3,740 | $41,060 |
| 2022 | $860 | $40,200 | $3,730 | $36,470 |
| 2021 | $910 | $40,200 | $3,730 | $36,470 |
| 2020 | $896 | $40,200 | $3,730 | $36,470 |
| 2019 | $896 | $40,200 | $3,730 | $36,470 |
| 2018 | $828 | $37,160 | $3,730 | $33,430 |
| 2017 | $784 | $37,160 | $3,730 | $33,430 |
| 2016 | $774 | $34,120 | $3,730 | $30,390 |
| 2015 | $774 | $34,120 | $3,730 | $30,390 |
| 2014 | $788 | $34,120 | $3,730 | $30,390 |
Source: Public Records
Map
Nearby Homes
- 1124 Oleson Rd
- 3256 Hammond Ave
- 3420 Crown Ct Unit 3420
- 1445 Hammond Ave
- 1152 Wisner Dr
- 3024 W 9th St
- 2547 W 9th St
- 1714 Easton Ave
- 3124 W 9th St
- 1161 Easton Ave
- 1933 Plymouth Ave
- 0 Alexandra Dr
- 2624 Manor St
- 1924 Locke Ave
- 1015 Amherst Ave
- 1219 Hammond Ave
- 1201 Lyon Ave
- 814 Locke Ave
- 1147 Bourland Ave
- 630 Burbank Ave
- 1126 Langley Rd Unit 8
- 1126 Langley Rd Unit 7
- 1126 Langley Rd Unit 6
- 1126 Langley Rd Unit 5
- 1126 Langley Rd Unit 4
- 1126 Langley Rd Unit 3
- 1126 Langley Rd Unit 2
- 1126 Langley Rd
- 1126 Langley Rd
- 1112 Langley Rd Unit 8
- 1112 Langley Rd Unit 7
- 1112 Langley Rd Unit 6
- 1112 Langley Rd Unit 5
- 1112 Langley Rd Unit 4
- 1112 Langley Rd Unit 3
- 1112 Langley Rd Unit 2
- 1112 Langley Rd Unit 1
- 1105 Kaplan Dr
- 1111 Kaplan Dr
- 1051 Kaplan Dr