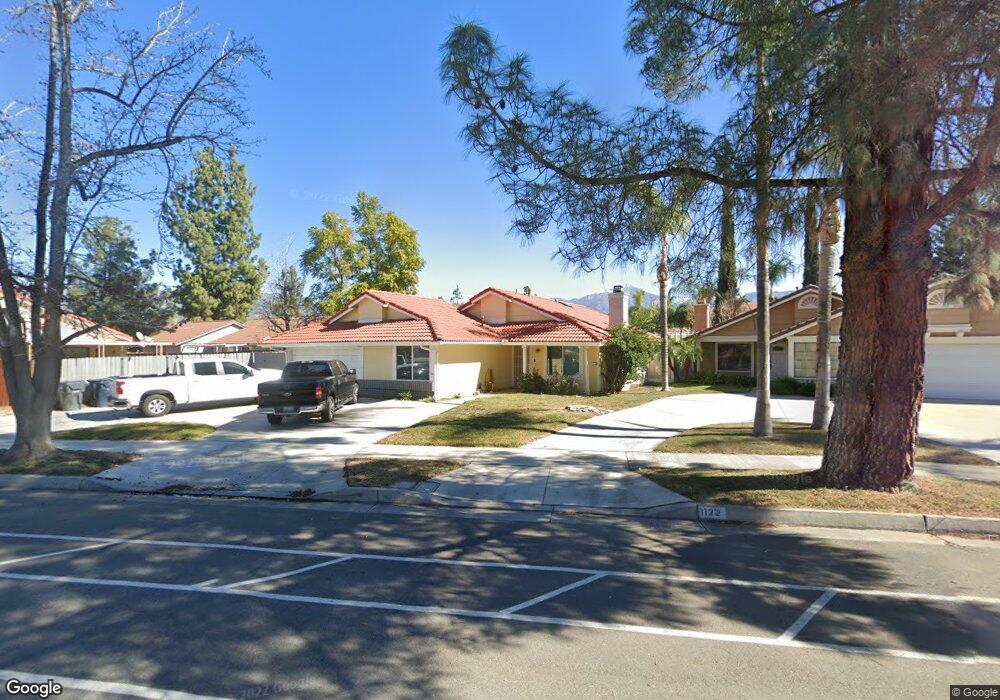
1126 N Dearborn St Redlands, CA 92374
North Redlands NeighborhoodEstimated Value: $587,000 - $640,000
3
Beds
2
Baths
1,462
Sq Ft
$419/Sq Ft
Est. Value
About This Home
This home is located at 1126 N Dearborn St, Redlands, CA 92374 and is currently estimated at $612,340, approximately $418 per square foot. 1126 N Dearborn St is a home located in San Bernardino County with nearby schools including Crafton Elementary School, Clement Middle School, and Redlands East Valley High School.
Ownership History
Date
Name
Owned For
Owner Type
Purchase Details
Closed on
Nov 13, 2013
Sold by
Dehart Anthony B
Bought by
Dehart Anthony B and Study Daniell J
Current Estimated Value
Purchase Details
Closed on
Oct 5, 2007
Sold by
Dehart Lisa Mae
Bought by
Dehart Anthony B
Home Financials for this Owner
Home Financials are based on the most recent Mortgage that was taken out on this home.
Original Mortgage
$235,000
Outstanding Balance
$147,008
Interest Rate
6.25%
Mortgage Type
New Conventional
Estimated Equity
$465,332
Purchase Details
Closed on
Jun 6, 2006
Sold by
Dehart Anthony B
Bought by
Dehart Anthony B and Dehart Lisa Mae
Purchase Details
Closed on
Sep 18, 2001
Sold by
Pham John Hung
Bought by
Bui An Kim
Home Financials for this Owner
Home Financials are based on the most recent Mortgage that was taken out on this home.
Original Mortgage
$159,600
Interest Rate
6.91%
Purchase Details
Closed on
Sep 6, 2001
Sold by
Bui An Kim
Bought by
Dehart Anthony B
Home Financials for this Owner
Home Financials are based on the most recent Mortgage that was taken out on this home.
Original Mortgage
$159,600
Interest Rate
6.91%
Purchase Details
Closed on
May 22, 1995
Sold by
Pham James Phu Van and Nguyen Cassie Kim
Bought by
Bui An Kim
Create a Home Valuation Report for This Property
The Home Valuation Report is an in-depth analysis detailing your home's value as well as a comparison with similar homes in the area
Home Values in the Area
Average Home Value in this Area
Purchase History
| Date | Buyer | Sale Price | Title Company |
|---|---|---|---|
| Dehart Anthony B | -- | None Available | |
| Dehart Anthony B | -- | Fidelity National Title Co | |
| Dehart Anthony B | -- | None Available | |
| Bui An Kim | -- | Chicago Title Co | |
| Dehart Anthony B | $168,000 | Chicago Title Co | |
| Dehart Anthony B | -- | Chicago Title Co | |
| Bui An Kim | -- | -- |
Source: Public Records
Mortgage History
| Date | Status | Borrower | Loan Amount |
|---|---|---|---|
| Open | Dehart Anthony B | $235,000 | |
| Closed | Dehart Anthony B | $159,600 |
Source: Public Records
Tax History
| Year | Tax Paid | Tax Assessment Tax Assessment Total Assessment is a certain percentage of the fair market value that is determined by local assessors to be the total taxable value of land and additions on the property. | Land | Improvement |
|---|---|---|---|---|
| 2025 | $3,275 | $268,685 | $62,047 | $206,638 |
| 2024 | $3,058 | $263,416 | $60,830 | $202,586 |
| 2023 | $3,053 | $258,251 | $59,637 | $198,614 |
| 2022 | $3,007 | $253,188 | $58,468 | $194,720 |
| 2021 | $3,060 | $248,224 | $57,322 | $190,902 |
| 2020 | $3,014 | $245,679 | $56,734 | $188,945 |
| 2019 | $2,928 | $240,862 | $55,622 | $185,240 |
| 2018 | $2,854 | $236,139 | $54,531 | $181,608 |
| 2017 | $2,828 | $231,509 | $53,462 | $178,047 |
| 2016 | $2,795 | $226,970 | $52,414 | $174,556 |
| 2015 | $2,773 | $223,561 | $51,627 | $171,934 |
| 2014 | $2,722 | $219,182 | $50,616 | $168,566 |
Source: Public Records
Map
Nearby Homes
- 1160 Via Ravenna
- 1617 Waterford Ave
- 1721 E Colton Ave Unit 33
- 1721 E Colton Ave Unit 106
- 1721 E Colton Ave Unit 115
- 0 E Colton Ave
- 626 N Dearborn St Unit 150
- 626 N Dearborn St Unit 7
- 626 N Dearborn St
- 616 N Lincoln St
- 936 Judson St
- 917 Renee St
- 1537 Carmel Ct
- 1700 Sandpiper Ave
- 1574 Foothill Way
- 1528 Laramie Ave
- 1326 Campus Ave
- 1731 Wren Ave
- 1713 Wren Ave
- 1558 Oriole St
- 1122 N Dearborn St
- 1610 Maple Ave
- 1614 Maple Ave
- 1118 N Dearborn St
- 1606 Maple Ave
- 1618 Maple Ave
- 1125 Jasmine St
- 1121 Jasmine St
- 1114 N Dearborn St
- 1622 Maple Ave
- 1575 Dover Ct
- 1117 Jasmine St
- 1129 Jasmine St
- 1211 Heath St
- 1110 N Dearborn St
- 1626 Maple Ave
- 1204 N Dearborn St
- 1578 Dover Ct
- 1113 Jasmine St
- 1127 N Dearborn St
Your Personal Tour Guide
Ask me questions while you tour the home.