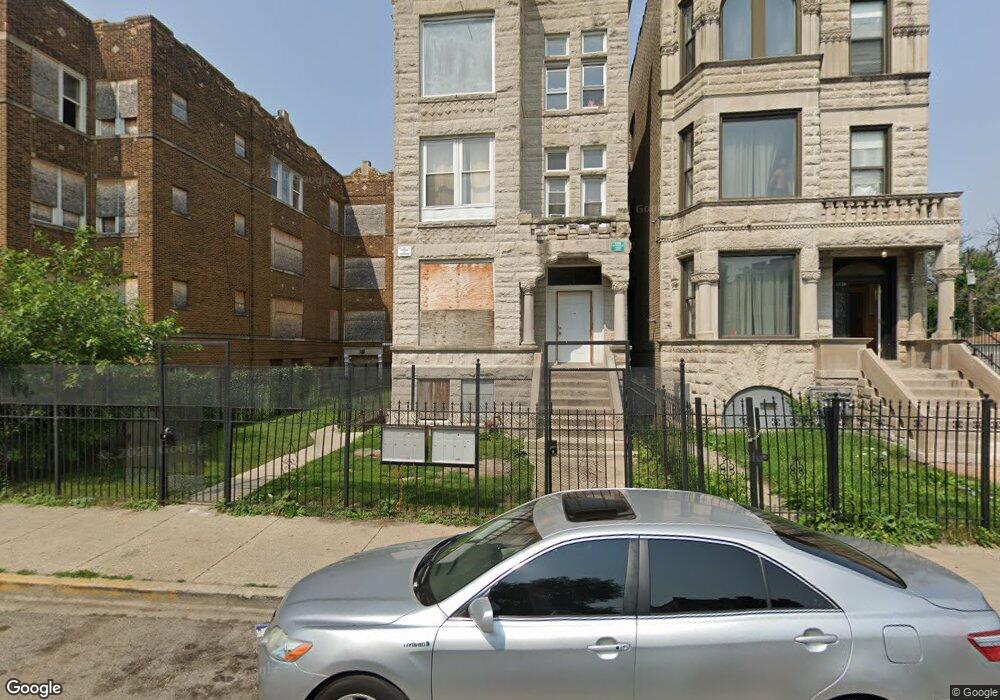
1126 S Richmond St Unit 1 Chicago, IL 60612
Garfield Park NeighborhoodEstimated Value: $196,223 - $327,000
5
Beds
2
Baths
1,200
Sq Ft
$199/Sq Ft
Est. Value
About This Home
This home is located at 1126 S Richmond St Unit 1, Chicago, IL 60612 and is currently estimated at $238,556, approximately $198 per square foot. 1126 S Richmond St Unit 1 is a home located in Cook County with nearby schools including Jensen Miller Scholastic Academy, North Lawndale Charter High School, and Altus Academy.
Ownership History
Date
Name
Owned For
Owner Type
Purchase Details
Closed on
Apr 13, 2016
Sold by
Moutafov Jordan
Bought by
Kokoland Llc
Current Estimated Value
Purchase Details
Closed on
Oct 13, 2014
Sold by
Kaja Holdings 2 Llc
Bought by
Moutafov Jordan
Purchase Details
Closed on
Dec 12, 2013
Sold by
Federal National Mortgage Association
Bought by
Kaja Holdings 2 Llc
Purchase Details
Closed on
Jun 12, 2012
Sold by
Romero Angel
Bought by
Federal National Mortgage Association
Purchase Details
Closed on
Mar 5, 2008
Sold by
Tralmer Properties Llc
Bought by
Romero Angel and Romero Shayna
Purchase Details
Closed on
Apr 11, 2007
Sold by
Deutsche Bank National Trust Co
Bought by
Tralmer Properties Llc
Purchase Details
Closed on
Feb 15, 2007
Sold by
Baran Ireneusz
Bought by
Deutsche Bank National Trust Co and Imh Assets Corp Collateralized Asset Bac
Create a Home Valuation Report for This Property
The Home Valuation Report is an in-depth analysis detailing your home's value as well as a comparison with similar homes in the area
Home Values in the Area
Average Home Value in this Area
Purchase History
| Date | Buyer | Sale Price | Title Company |
|---|---|---|---|
| Kokoland Llc | -- | Attorney | |
| Moutafov Jordan | $3,000 | None Available | |
| Kaja Holdings 2 Llc | $2,700 | Servicelink | |
| Federal National Mortgage Association | -- | None Available | |
| Romero Angel | -- | None Available | |
| Tralmer Properties Llc | $27,500 | First American | |
| Deutsche Bank National Trust Co | -- | None Available |
Source: Public Records
Tax History Compared to Growth
Tax History
| Year | Tax Paid | Tax Assessment Tax Assessment Total Assessment is a certain percentage of the fair market value that is determined by local assessors to be the total taxable value of land and additions on the property. | Land | Improvement |
|---|---|---|---|---|
| 2024 | $2,321 | $23,280 | $1,665 | $21,615 |
| 2023 | $2,262 | $11,000 | $1,349 | $9,651 |
| 2022 | $2,262 | $11,000 | $1,349 | $9,651 |
| 2021 | $2,212 | $10,999 | $1,349 | $9,650 |
| 2020 | $1,953 | $8,765 | $1,349 | $7,416 |
| 2019 | $1,953 | $9,722 | $1,349 | $8,373 |
| 2018 | $1,920 | $9,722 | $1,349 | $8,373 |
| 2017 | $1,905 | $8,848 | $1,205 | $7,643 |
| 2016 | $1,772 | $8,848 | $1,205 | $7,643 |
| 2015 | $1,621 | $8,848 | $1,205 | $7,643 |
| 2014 | $2,637 | $14,211 | $1,205 | $13,006 |
| 2013 | $2,585 | $14,211 | $1,205 | $13,006 |
Source: Public Records
Map
Nearby Homes
- 1132 S Sacramento Blvd
- 3000 W Roosevelt Rd
- 1104 S Richmond St
- 1125 S Richmond St
- 1106 S Francisco Ave
- 3113 W Roosevelt Rd
- 2426 W Arthington St
- 1024 S California Ave
- 2839 W Arthington St
- 2835 W Arthington St
- 711 S California Ave
- 709 S California Ave
- 1246 S Fairfield Ave
- 3100 W Douglas Blvd
- 3130 W Polk St
- 3115 W Lexington St
- 2939 W Flournoy St
- 1301 S Fairfield Ave
- 3039 W Flournoy St
- 3041 W Flournoy St
- 1126 S Richmond St
- 1126 S Richmond St Unit 4
- 1126 S Richmond St Unit 3E
- 1126 S Richmond St Unit 2E
- 1126 S Richmond St Unit 3W
- 1126 S Richmond St Unit 2W
- 1130 S Richmond St
- 1124 S Richmond St Unit 3
- 1124 S Richmond St Unit 1
- 1124 S Richmond St
- 1124 S Richmond St
- 1138 S Richmond St
- 1112 S Richmond St
- 1112 S Richmond St Unit 1
- 1131 S Sacramento Blvd
- 1110 S Richmond St
- 1110 S Richmond St
- 1119 S Sacramento Blvd
- 1129 S Richmond St
- 1129 S Richmond St