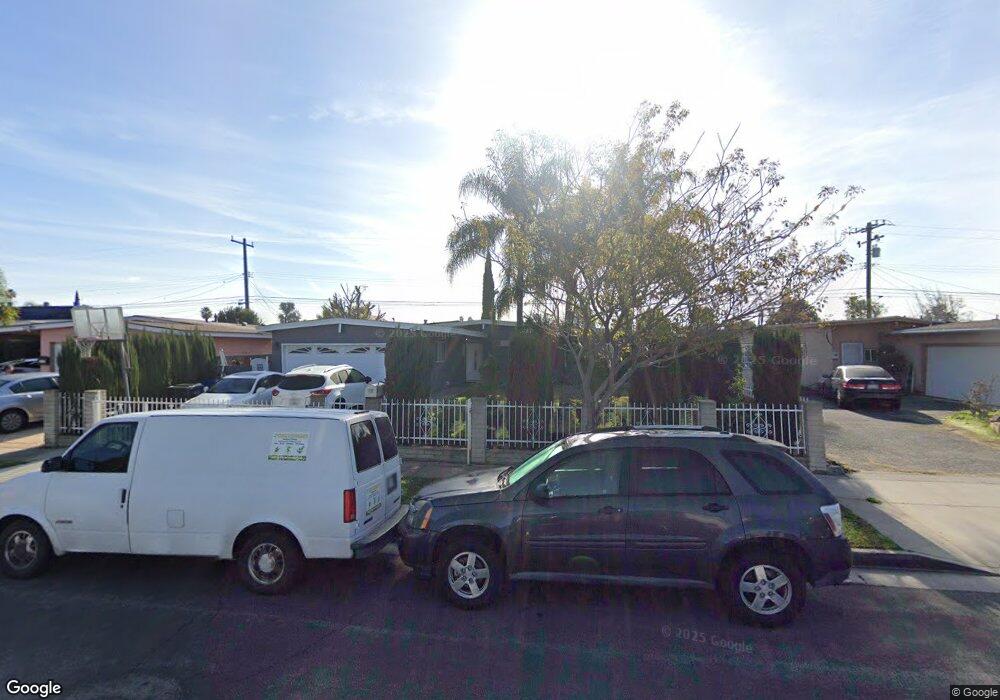
1126 Stichman Ave La Puente, CA 91746
West Puente Valley NeighborhoodEstimated Value: $714,044 - $803,000
3
Beds
2
Baths
1,412
Sq Ft
$532/Sq Ft
Est. Value
About This Home
This home is located at 1126 Stichman Ave, La Puente, CA 91746 and is currently estimated at $751,761, approximately $532 per square foot. 1126 Stichman Ave is a home located in Los Angeles County with nearby schools including J.E. Van Wig Elementary School, Torch Middle School, and Bassett Senior High School.
Ownership History
Date
Name
Owned For
Owner Type
Purchase Details
Closed on
Dec 1, 2018
Sold by
Duran Juan V and Duran Rosa B
Bought by
Duran Juan V and Duran Rosa B
Current Estimated Value
Purchase Details
Closed on
Jun 4, 2001
Sold by
Ruiz Elisa N
Bought by
Duran Juan and Duran Rosa B
Home Financials for this Owner
Home Financials are based on the most recent Mortgage that was taken out on this home.
Original Mortgage
$171,000
Interest Rate
7.14%
Purchase Details
Closed on
May 6, 1997
Sold by
Ruiz Elisa N
Bought by
Ruiz Eisa N and Duran Juan
Home Financials for this Owner
Home Financials are based on the most recent Mortgage that was taken out on this home.
Original Mortgage
$40,000
Interest Rate
8.15%
Mortgage Type
Stand Alone Second
Purchase Details
Closed on
Oct 14, 1996
Sold by
Transamerica Financial Services
Bought by
Benavides David
Create a Home Valuation Report for This Property
The Home Valuation Report is an in-depth analysis detailing your home's value as well as a comparison with similar homes in the area
Home Values in the Area
Average Home Value in this Area
Purchase History
| Date | Buyer | Sale Price | Title Company |
|---|---|---|---|
| Duran Juan V | -- | None Available | |
| Duran Juan | -- | Southland Title Corporation | |
| Ruiz Eisa N | -- | American Title Ins Co | |
| Benavides David | $65,909 | Fidelity Title |
Source: Public Records
Mortgage History
| Date | Status | Borrower | Loan Amount |
|---|---|---|---|
| Closed | Duran Juan | $171,000 | |
| Previous Owner | Ruiz Eisa N | $40,000 |
Source: Public Records
Tax History Compared to Growth
Tax History
| Year | Tax Paid | Tax Assessment Tax Assessment Total Assessment is a certain percentage of the fair market value that is determined by local assessors to be the total taxable value of land and additions on the property. | Land | Improvement |
|---|---|---|---|---|
| 2025 | $3,404 | $240,901 | $144,351 | $96,550 |
| 2024 | $3,404 | $236,178 | $141,521 | $94,657 |
| 2023 | $3,304 | $231,548 | $138,747 | $92,801 |
| 2022 | $3,168 | $227,009 | $136,027 | $90,982 |
| 2021 | $3,106 | $222,559 | $133,360 | $89,199 |
| 2019 | $3,029 | $215,959 | $129,405 | $86,554 |
| 2018 | $2,899 | $211,725 | $126,868 | $84,857 |
| 2016 | $2,777 | $203,506 | $121,943 | $81,563 |
| 2015 | $2,710 | $200,450 | $120,112 | $80,338 |
| 2014 | $2,589 | $196,525 | $117,760 | $78,765 |
Source: Public Records
Map
Nearby Homes
- 1003 Le Borgne Ave
- 915 Stichman Ave
- 1416 Millbury Ave
- 14104 Barrydale St
- 13974 Francisquito Ave Unit 8
- 720 Le Borgne Ave
- 979 Willow Ave Unit 31
- 943 Willow Ave
- 3004 Via Delores
- 3109 Robinette Ave
- 13120 Dart St Unit E
- 3060 Vineland Ave Unit 7
- 1525 Bromley Ave
- 1718 Puente Ave Unit 40
- 13522 Francisquito Ave Unit C
- 1735 Puente Ave Unit 30
- 13438 Francisquito Ave
- 3314 Baldwin Park Blvd
- 13426 Austen Way
- 13622 Hartsville St
- 1132 Stichman Ave
- 1120 Stichman Ave
- 1127 Le Borgne Ave
- 1136 Stichman Ave
- 1114 Stichman Ave
- 1133 Le Borgne Ave
- 1121 Le Borgne Ave
- 1137 Le Borgne Ave
- 1115 Le Borgne Ave
- 1127 Stichman Ave
- 1142 Stichman Ave
- 1108 Stichman Ave
- 1121 Stichman Ave
- 1133 Stichman Ave
- 1115 Stichman Ave
- 1139 Stichman Ave
- 1143 Le Borgne Ave
- 1109 Le Borgne Ave
- 1148 Stichman Ave
- 1102 Stichman Ave