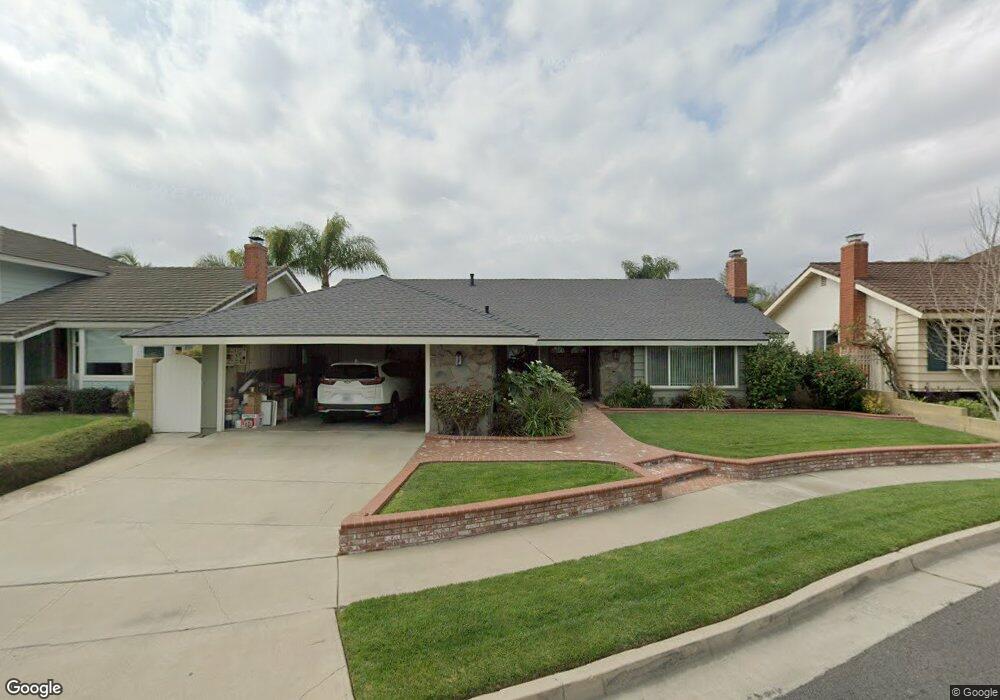
11265 Linda Way Los Alamitos, CA 90720
Estimated Value: $1,294,386 - $1,558,000
4
Beds
2
Baths
1,840
Sq Ft
$808/Sq Ft
Est. Value
About This Home
This home is located at 11265 Linda Way, Los Alamitos, CA 90720 and is currently estimated at $1,487,097, approximately $808 per square foot. 11265 Linda Way is a home located in Orange County with nearby schools including Rossmoor Elementary School, Jack L. Weaver Elementary School, and Oak Middle School.
Ownership History
Date
Name
Owned For
Owner Type
Purchase Details
Closed on
Oct 14, 2021
Sold by
Olson Michelle L
Bought by
Olson Michelle L and Michelle L Olson Trust
Current Estimated Value
Purchase Details
Closed on
Oct 23, 1999
Sold by
Dale Olson and Dale Michelle
Bought by
Olson Dale A and Olson Michelle L
Purchase Details
Closed on
Jun 4, 1996
Sold by
Aguilera Dianne K
Bought by
Olson Dale and Olson Michelle
Home Financials for this Owner
Home Financials are based on the most recent Mortgage that was taken out on this home.
Original Mortgage
$204,000
Interest Rate
8.03%
Purchase Details
Closed on
May 6, 1994
Sold by
Aguilera Dianne K
Bought by
Aguilera Dianne
Purchase Details
Closed on
Sep 7, 1993
Sold by
Aguilera Dianne K and Aguilera Dianne
Bought by
Aguilera Dianne K
Home Financials for this Owner
Home Financials are based on the most recent Mortgage that was taken out on this home.
Original Mortgage
$98,000
Interest Rate
7.25%
Create a Home Valuation Report for This Property
The Home Valuation Report is an in-depth analysis detailing your home's value as well as a comparison with similar homes in the area
Home Values in the Area
Average Home Value in this Area
Purchase History
| Date | Buyer | Sale Price | Title Company |
|---|---|---|---|
| Olson Michelle L | -- | Accommodation | |
| Olson Michelle L | -- | Accommodation | |
| Olson Dale A | -- | -- | |
| Olson Dale | $275,000 | Chicago Title Co | |
| Aguilera Dianne | -- | -- | |
| Aguilera Dianne K | -- | Fidelity National Title |
Source: Public Records
Mortgage History
| Date | Status | Borrower | Loan Amount |
|---|---|---|---|
| Previous Owner | Olson Dale | $204,000 | |
| Previous Owner | Aguilera Dianne K | $98,000 |
Source: Public Records
Tax History Compared to Growth
Tax History
| Year | Tax Paid | Tax Assessment Tax Assessment Total Assessment is a certain percentage of the fair market value that is determined by local assessors to be the total taxable value of land and additions on the property. | Land | Improvement |
|---|---|---|---|---|
| 2025 | $5,415 | $432,801 | $293,148 | $139,653 |
| 2024 | $5,415 | $439,096 | $287,400 | $151,696 |
| 2023 | $5,286 | $430,487 | $281,765 | $148,722 |
| 2022 | $5,255 | $422,047 | $276,241 | $145,806 |
| 2021 | $5,140 | $413,772 | $270,824 | $142,948 |
| 2020 | $5,149 | $409,530 | $268,047 | $141,483 |
| 2019 | $4,966 | $401,500 | $262,791 | $138,709 |
| 2018 | $4,732 | $393,628 | $257,638 | $135,990 |
| 2017 | $4,630 | $385,910 | $252,586 | $133,324 |
| 2016 | $4,539 | $378,344 | $247,634 | $130,710 |
| 2015 | $4,484 | $372,661 | $243,914 | $128,747 |
| 2014 | $4,328 | $365,362 | $239,136 | $126,226 |
Source: Public Records
Map
Nearby Homes
- 3845 Farquhar Ave Unit 110
- 3802 Howard Ave
- 3804 Howard Ave
- 3701 La Colmena Way
- 10842 Pine St
- 11771 Paseo Bonita
- 3391 Rossmoor Way
- 3312 Kenilworth Dr
- 11862 Paseo Bonita
- 4311 Howard Ave
- 3311 Rossmoor Way
- 11385 Baskerville Rd
- 4411 Farquhar Ave
- 3122 Ruth Elaine Dr
- 3272 Saint Albans Dr
- 11291 Wembley Rd
- 12111 Reagan St
- 10681 Oak St Unit 29
- 3162 Inverness Dr
- 3342 Bradbury Rd Unit 34
- 11275 Linda Way
- 11245 Linda Way
- 11264 Rochelle St
- 11274 Rochelle St
- 11244 Rochelle St
- 11295 Linda Way
- 11294 Rochelle St
- 11266 Linda Way
- 11276 Linda Way
- 11246 Linda Way
- 11305 Linda Way
- 11296 Linda Way
- 11304 Rochelle St
- 11315 Linda Way
- 11306 Linda Way
- 11263 Rochelle St
- 11267 Barbi Ln
- 11273 Rochelle St
- 11243 Rochelle St
- 11314 Rochelle St