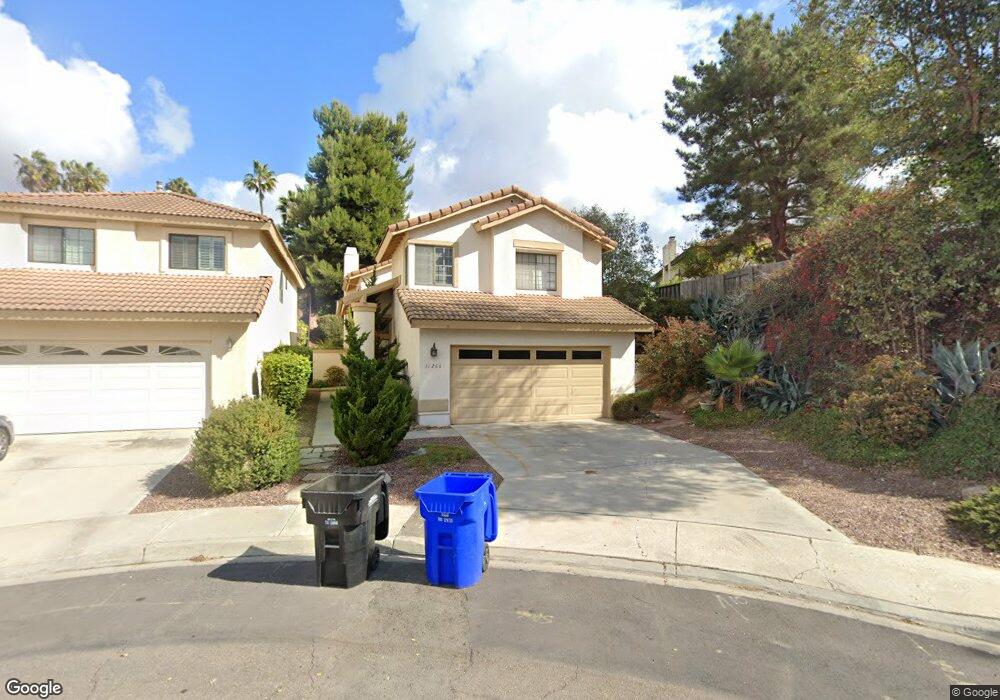
11266 Sunnydale Ct Unit 5 San Diego, CA 92127
Rancho Bernardo NeighborhoodEstimated Value: $1,261,560 - $1,348,000
4
Beds
3
Baths
1,832
Sq Ft
$712/Sq Ft
Est. Value
About This Home
This home is located at 11266 Sunnydale Ct Unit 5, San Diego, CA 92127 and is currently estimated at $1,304,640, approximately $712 per square foot. 11266 Sunnydale Ct Unit 5 is a home located in San Diego County with nearby schools including Turtleback Elementary, Bernardo Heights Middle, and Rancho Bernardo High.
Ownership History
Date
Name
Owned For
Owner Type
Purchase Details
Closed on
Feb 19, 2015
Sold by
Carroll James B and Carroll Jeanna Capulong
Bought by
Carroll Family Trust
Current Estimated Value
Home Financials for this Owner
Home Financials are based on the most recent Mortgage that was taken out on this home.
Original Mortgage
$328,325
Outstanding Balance
$249,979
Interest Rate
3.6%
Mortgage Type
New Conventional
Estimated Equity
$1,054,661
Purchase Details
Closed on
Feb 8, 2012
Sold by
Carroll James B and Carroll Jeanna Capulong
Bought by
Carroll James B and Carroll Jeanna Capulong
Home Financials for this Owner
Home Financials are based on the most recent Mortgage that was taken out on this home.
Original Mortgage
$342,375
Interest Rate
3.86%
Mortgage Type
New Conventional
Purchase Details
Closed on
Jan 31, 2008
Sold by
Carroll James B and Carroll Jeanna Capulong
Bought by
Carroll James B and Carroll Jeanna Capulong
Home Financials for this Owner
Home Financials are based on the most recent Mortgage that was taken out on this home.
Original Mortgage
$377,000
Interest Rate
6.17%
Mortgage Type
Stand Alone Refi Refinance Of Original Loan
Purchase Details
Closed on
Mar 8, 2005
Sold by
Carroll James B and Carroll Jeanna
Bought by
Carroll James B and Carroll Jeanna Capulong
Purchase Details
Closed on
Nov 18, 2003
Sold by
Brennan David M and Brennan Lynne M
Bought by
Carroll James B and Carroll Jeanna
Home Financials for this Owner
Home Financials are based on the most recent Mortgage that was taken out on this home.
Original Mortgage
$406,400
Interest Rate
5.62%
Mortgage Type
Purchase Money Mortgage
Purchase Details
Closed on
Apr 28, 2003
Sold by
Brennan David M and Brennan Lynne M
Bought by
Brennan David Matthew and Brennan Lynne Marie
Purchase Details
Closed on
Jun 5, 2000
Sold by
Vandermey Richard C and Vandermey Sharon E
Bought by
Brennan David M and Brennan Lynne M
Home Financials for this Owner
Home Financials are based on the most recent Mortgage that was taken out on this home.
Original Mortgage
$245,430
Interest Rate
3.95%
Purchase Details
Closed on
May 13, 1996
Sold by
Larkins Wallis F and Larkins Catherine A
Bought by
Vandermey Richard C and Vandermey Sharon E
Home Financials for this Owner
Home Financials are based on the most recent Mortgage that was taken out on this home.
Original Mortgage
$199,950
Interest Rate
8.25%
Purchase Details
Closed on
Jan 31, 1986
Create a Home Valuation Report for This Property
The Home Valuation Report is an in-depth analysis detailing your home's value as well as a comparison with similar homes in the area
Home Values in the Area
Average Home Value in this Area
Purchase History
| Date | Buyer | Sale Price | Title Company |
|---|---|---|---|
| Carroll Family Trust | -- | Tsi Title | |
| Carroll James B | -- | Tsi Title | |
| Carroll James B | -- | Tsi | |
| Carroll James B | -- | Tsi | |
| Carroll James B | -- | First American Title Ins Co | |
| Carroll James B | -- | First American Title Ins Co | |
| Carroll James B | -- | -- | |
| Carroll James B | $508,000 | Fidelity National Title | |
| Brennan David Matthew | -- | -- | |
| Brennan David M | $327,500 | California Title Company | |
| Vandermey Richard C | $210,500 | Continental Lawyers Title | |
| -- | $139,900 | -- |
Source: Public Records
Mortgage History
| Date | Status | Borrower | Loan Amount |
|---|---|---|---|
| Open | Carroll James B | $328,325 | |
| Closed | Carroll James B | $342,375 | |
| Closed | Carroll James B | $377,000 | |
| Closed | Carroll James B | $406,400 | |
| Previous Owner | Brennan David M | $245,430 | |
| Previous Owner | Vandermey Richard C | $199,950 |
Source: Public Records
Tax History Compared to Growth
Tax History
| Year | Tax Paid | Tax Assessment Tax Assessment Total Assessment is a certain percentage of the fair market value that is determined by local assessors to be the total taxable value of land and additions on the property. | Land | Improvement |
|---|---|---|---|---|
| 2025 | $7,948 | $722,260 | $412,314 | $309,946 |
| 2024 | $7,948 | $708,099 | $404,230 | $303,869 |
| 2023 | $7,778 | $694,215 | $396,304 | $297,911 |
| 2022 | $7,647 | $680,604 | $388,534 | $292,070 |
| 2021 | $7,546 | $667,260 | $380,916 | $286,344 |
| 2020 | $7,444 | $660,419 | $377,011 | $283,408 |
| 2019 | $7,249 | $647,470 | $369,619 | $277,851 |
| 2018 | $7,044 | $634,775 | $362,372 | $272,403 |
| 2017 | $83 | $622,329 | $355,267 | $267,062 |
| 2016 | $6,713 | $610,127 | $348,301 | $261,826 |
| 2015 | $6,613 | $600,964 | $343,070 | $257,894 |
| 2014 | $6,025 | $550,000 | $313,000 | $237,000 |
Source: Public Records
Map
Nearby Homes
- 15353 Maturin Dr Unit 115
- 15273 Maturin Dr Unit 40
- 15283 Maturin Dr Unit 62
- 15373 Maturin Dr Unit 178
- 11313 Avenida de Los Lobos Unit B
- 11263 Avenida de Los Lobos Unit D
- 11781 Caminito de Las Missiones
- 11705 Via Medanos
- 16003 Caminito de Linda
- 15985 Camino Crisalida Unit 5
- 15610 Corte Raposo
- 16232 Avenida Venusto Unit B
- 16244 Avenida Venusto Unit A
- 16430 Avenida Venusto Unit D
- 11384 Almazon St
- 16205 Via Embeleso
- 15541 Paseo Jenghiz
- 11385 Paseo Albacete
- 12141 Iron View Row
- 11378 Ajanta Ct
- 11258 Sunnydale Ct
- 16092 Blazewood Way
- 11250 Sunnydale Ct
- 16085 Blazewood Way
- 16084 Blazewood Way
- 11242 Sunnydale Ct
- 16076 Blazewood Way
- 11236 Sunnydale Ct
- 16077 Blazewood Way
- 16111 Rimstone Ln
- 11230 Sunnydale Ct
- 11265 Sunnydale Ct
- 11245 Sunnydale Ct
- 11202 Trailside Ct
- 16068 Blazewood Way
- 11255 Sunnydale Ct
- 11235 Sunnydale Ct
- 16069 Blazewood Way Unit 3
- 16119 Rimstone Ln
- 11230 Blazewood Place