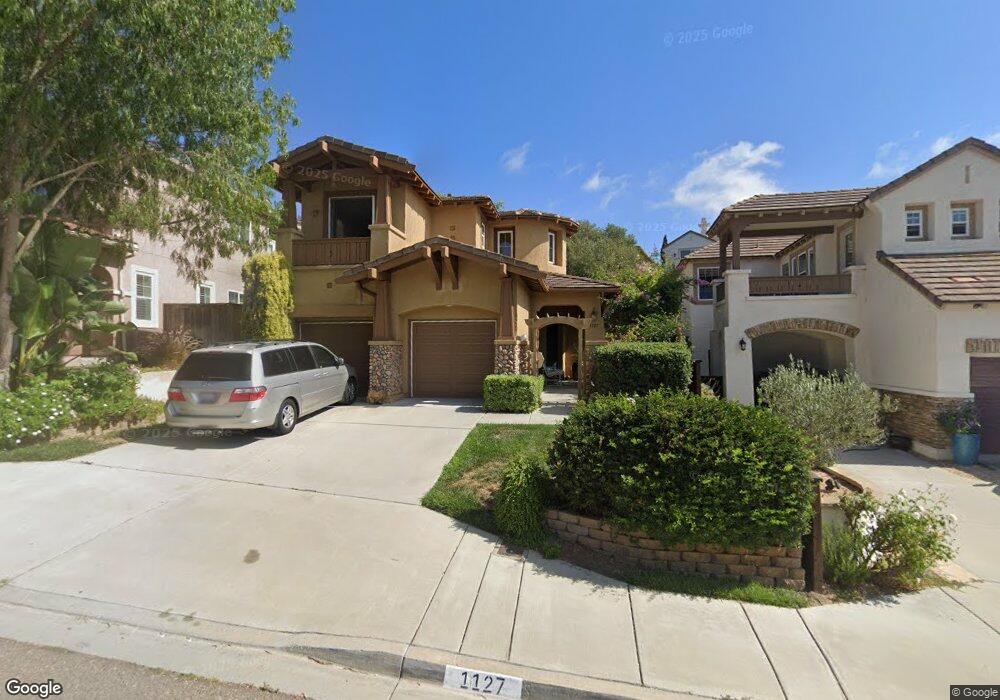
1127 Calistoga Way Unit 2 San Marcos, CA 92078
San Elijo NeighborhoodEstimated Value: $1,215,406 - $1,278,000
3
Beds
3
Baths
1,673
Sq Ft
$748/Sq Ft
Est. Value
About This Home
This home is located at 1127 Calistoga Way Unit 2, San Marcos, CA 92078 and is currently estimated at $1,251,852, approximately $748 per square foot. 1127 Calistoga Way Unit 2 is a home located in San Diego County with nearby schools including San Elijo Elementary School, San Elijo Middle School, and San Marcos High School.
Ownership History
Date
Name
Owned For
Owner Type
Purchase Details
Closed on
Apr 21, 2003
Sold by
Murphy Erica L and Murphy Joseph Jeff
Bought by
Dauphinee Rosemary A
Current Estimated Value
Home Financials for this Owner
Home Financials are based on the most recent Mortgage that was taken out on this home.
Original Mortgage
$100,000
Outstanding Balance
$43,022
Interest Rate
5.77%
Estimated Equity
$1,208,830
Purchase Details
Closed on
Feb 4, 2002
Sold by
Continental Residential Inc
Bought by
Murphy Joseph Jeff and Murphy Erica L
Home Financials for this Owner
Home Financials are based on the most recent Mortgage that was taken out on this home.
Original Mortgage
$273,100
Interest Rate
6.37%
Create a Home Valuation Report for This Property
The Home Valuation Report is an in-depth analysis detailing your home's value as well as a comparison with similar homes in the area
Home Values in the Area
Average Home Value in this Area
Purchase History
| Date | Buyer | Sale Price | Title Company |
|---|---|---|---|
| Dauphinee Rosemary A | $446,000 | Equity Title Company | |
| Murphy Joseph Jeff | $341,500 | First American Title |
Source: Public Records
Mortgage History
| Date | Status | Borrower | Loan Amount |
|---|---|---|---|
| Open | Dauphinee Rosemary A | $100,000 | |
| Previous Owner | Murphy Joseph Jeff | $273,100 | |
| Closed | Murphy Joseph Jeff | $51,200 |
Source: Public Records
Tax History Compared to Growth
Tax History
| Year | Tax Paid | Tax Assessment Tax Assessment Total Assessment is a certain percentage of the fair market value that is determined by local assessors to be the total taxable value of land and additions on the property. | Land | Improvement |
|---|---|---|---|---|
| 2025 | $8,684 | $645,942 | $253,452 | $392,490 |
| 2024 | $8,684 | $633,278 | $248,483 | $384,795 |
| 2023 | $8,570 | $620,861 | $243,611 | $377,250 |
| 2022 | $8,410 | $608,688 | $238,835 | $369,853 |
| 2021 | $8,269 | $596,753 | $234,152 | $362,601 |
| 2020 | $8,231 | $590,635 | $231,752 | $358,883 |
| 2019 | $8,201 | $579,055 | $227,208 | $351,847 |
| 2018 | $8,006 | $567,702 | $222,753 | $344,949 |
| 2017 | $131 | $556,572 | $218,386 | $338,186 |
| 2016 | $7,733 | $545,659 | $214,104 | $331,555 |
| 2015 | $7,590 | $537,463 | $210,888 | $326,575 |
| 2014 | -- | $526,935 | $206,757 | $320,178 |
Source: Public Records
Map
Nearby Homes
- 1169 Westin Way
- 1162 Westin Way
- 1278 Highbluff Ave
- 1241 Highbluff Ave
- 1367 Sky Ridge Ct
- 1282 Highbluff Ave
- 1215 Highbluff Ave
- 1276 San Elijo Rd N
- 1264 San Elijo Rd N
- 1159 Elfin Forest Rd E
- 1607 Avery Rd
- 1393 Cattail Ct
- 1656 Avery Rd
- 923 Citrine Way
- 0 Questhaven Rd Unit NDP2501375
- 1452 Golden Sunset Dr
- 880 Summer Moon Rd Unit 22
- 840 Luminara Way
- 1456 Golden Sunset Dr
- 1726 Blue Water Ln
- 1129 Calistoga Way Unit 2
- 1123 Calistoga Way
- 1135 Calistoga Way
- 1121 Calistoga Way
- 1128 Glen Ellen Place
- 1124 Glen Ellen Place
- 1139 Calistoga Way
- 1132 Glen Ellen Place
- 1136 Glen Ellen Place
- 1143 Calistoga Way
- 1140 Glen Ellen Place
- 1126 Calistoga Way
- 1130 Calistoga Way
- 1122 Calistoga Way
- 1134 Calistoga Way
- 1144 Glen Ellen Place Unit 2
- 1120 Calistoga Way
- 1147 Calistoga Way Unit 2
- 1138 Calistoga Way
- 1148 Glen Ellen Place Unit 2