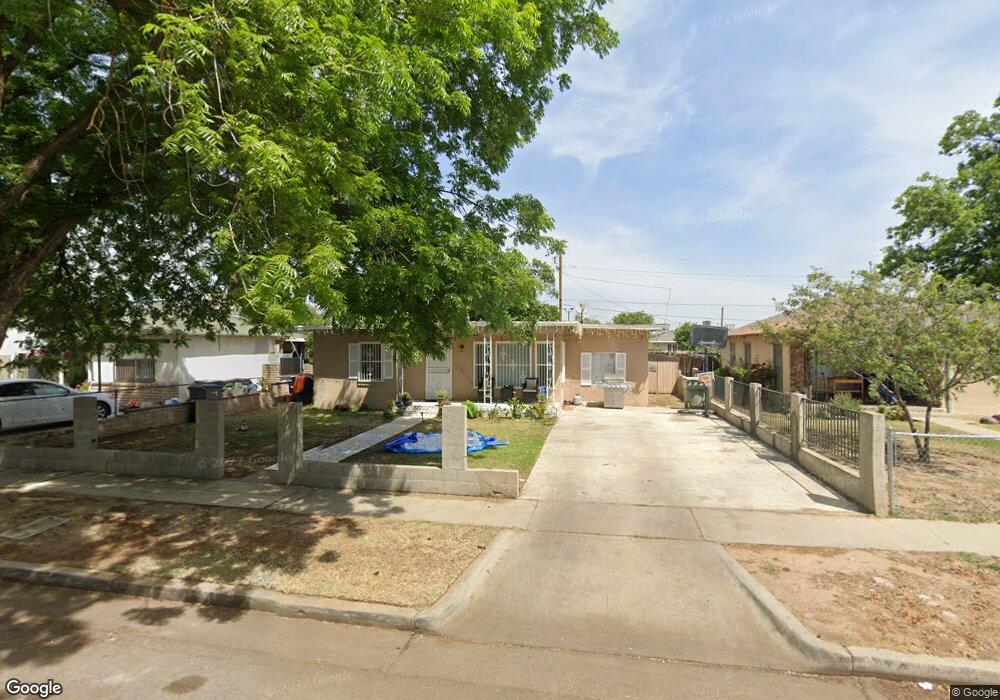
1127 E Byrd Ave Fresno, CA 93706
Edison NeighborhoodEstimated Value: $258,802 - $291,000
2
Beds
1
Bath
720
Sq Ft
$385/Sq Ft
Est. Value
About This Home
This home is located at 1127 E Byrd Ave, Fresno, CA 93706 and is currently estimated at $276,934, approximately $384 per square foot. 1127 E Byrd Ave is a home located in Fresno County with nearby schools including King Elementary School, Rutherford B. Gaston Sr. Middle, and Edison High School.
Ownership History
Date
Name
Owned For
Owner Type
Purchase Details
Closed on
Oct 25, 2004
Sold by
Corrales Ortiz Jose
Bought by
Sanchez Maria C
Current Estimated Value
Home Financials for this Owner
Home Financials are based on the most recent Mortgage that was taken out on this home.
Original Mortgage
$100,000
Outstanding Balance
$54,032
Interest Rate
7.15%
Mortgage Type
Purchase Money Mortgage
Estimated Equity
$222,902
Purchase Details
Closed on
Oct 4, 2004
Sold by
Rando James and Rando Stacey
Bought by
Sanchez Maria C
Home Financials for this Owner
Home Financials are based on the most recent Mortgage that was taken out on this home.
Original Mortgage
$100,000
Outstanding Balance
$54,032
Interest Rate
7.15%
Mortgage Type
Purchase Money Mortgage
Estimated Equity
$222,902
Purchase Details
Closed on
Jun 23, 2004
Sold by
Limbrick Timothy Victor
Bought by
Rando James and Rando Stacey
Purchase Details
Closed on
Jun 3, 1996
Sold by
Haywood Barbara
Bought by
Packard Jeanette and Haywood Vickie
Create a Home Valuation Report for This Property
The Home Valuation Report is an in-depth analysis detailing your home's value as well as a comparison with similar homes in the area
Home Values in the Area
Average Home Value in this Area
Purchase History
| Date | Buyer | Sale Price | Title Company |
|---|---|---|---|
| Sanchez Maria C | -- | First American Title Ins Co | |
| Sanchez Maria C | $125,000 | First American Title Ins Co | |
| Rando James | $80,000 | North American Title Co Inc | |
| Packard Jeanette | -- | -- |
Source: Public Records
Mortgage History
| Date | Status | Borrower | Loan Amount |
|---|---|---|---|
| Open | Sanchez Maria C | $100,000 | |
| Closed | Sanchez Maria C | $25,000 |
Source: Public Records
Tax History
| Year | Tax Paid | Tax Assessment Tax Assessment Total Assessment is a certain percentage of the fair market value that is determined by local assessors to be the total taxable value of land and additions on the property. | Land | Improvement |
|---|---|---|---|---|
| 2025 | $2,284 | $174,223 | $43,203 | $131,020 |
| 2023 | $1,085 | $83,000 | $40,300 | $42,700 |
| 2022 | $1,052 | $79,900 | $38,800 | $41,100 |
| 2021 | $877 | $66,700 | $32,400 | $34,300 |
| 2020 | $793 | $59,700 | $29,000 | $30,700 |
| 2019 | $739 | $56,600 | $27,500 | $29,100 |
| 2018 | $725 | $55,600 | $27,000 | $28,600 |
| 2017 | $683 | $52,100 | $25,300 | $26,800 |
| 2016 | $644 | $49,700 | $24,100 | $25,600 |
| 2015 | $585 | $44,900 | $21,800 | $23,100 |
| 2014 | $550 | $42,200 | $20,500 | $21,700 |
Source: Public Records
Map
Nearby Homes
- 1123 E Garrett Ave
- 937 E Calwa Ave
- 1407 E Church Ave
- 2695 S Tupman Ave
- 1871 E Vine Ave
- 2318 S Eunice Ave
- 2555 S Lotus Ave
- 506 E Jensen Ave
- 2523 S Lily Ave
- 1775 E Vine Ave
- 2252 S Eunice Ave
- 358 E Kaviland Ave
- 2305 S Elm Ave
- 316 E Kaviland Ave
- 1883 E Vine Ave
- 721 E Annadale Ave
- 701 Mayor Ave
- 2255 S Rose Ave
- 450 C St
- 2261 S Nicholas Ave
- 1137 E Byrd Ave
- 1117 E Byrd Ave
- 1107 E Byrd Ave
- 1147 E Byrd Ave
- 1126 E Grove Ave
- 1116 E Grove Ave
- 1136 E Grove Ave
- 1157 E Byrd Ave
- 1106 E Grove Ave
- 1146 E Grove Ave
- 1124 E Byrd Ave
- 1134 E Byrd Ave
- 1114 E Byrd Ave
- 1156 E Grove Ave
- 1207 E Byrd Ave
- 1144 E Byrd Ave
- 1104 E Byrd Ave
- 1047 E Byrd Ave
- 1154 E Byrd Ave
- 1206 E Grove Ave
Your Personal Tour Guide
Ask me questions while you tour the home.