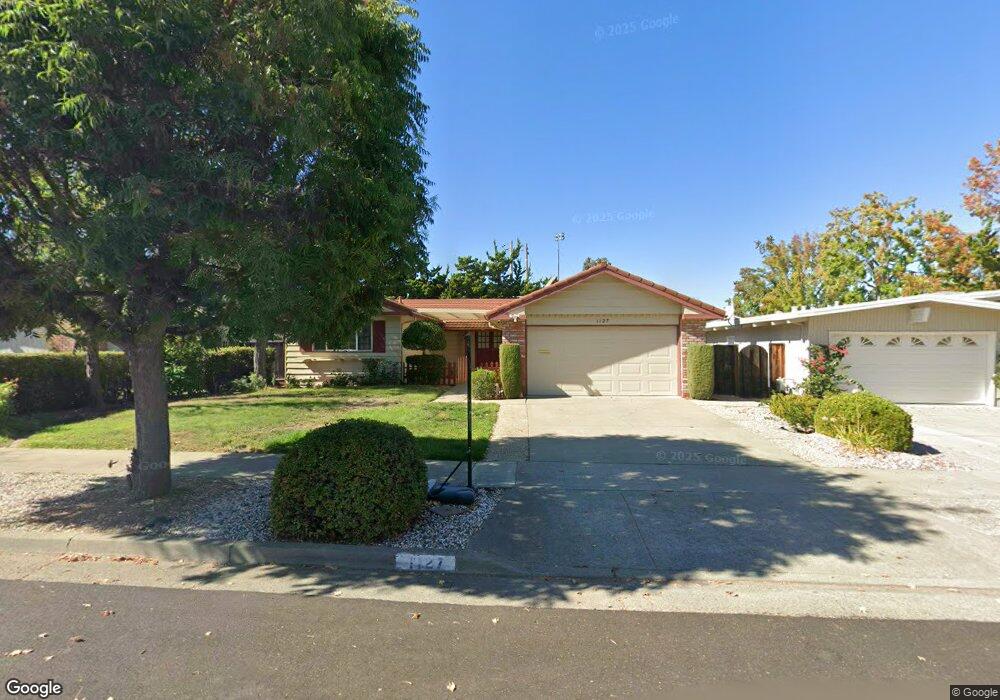
1127 Littleoak Cir San Jose, CA 95129
West San Jose NeighborhoodEstimated Value: $2,768,314 - $3,246,000
4
Beds
2
Baths
1,465
Sq Ft
$2,058/Sq Ft
Est. Value
About This Home
This home is located at 1127 Littleoak Cir, San Jose, CA 95129 and is currently estimated at $3,014,579, approximately $2,057 per square foot. 1127 Littleoak Cir is a home located in Santa Clara County with nearby schools including Nelson S. Dilworth Elementary School, Joaquin Miller Middle, and Lynbrook High School.
Ownership History
Date
Name
Owned For
Owner Type
Purchase Details
Closed on
Jul 20, 2022
Sold by
Cheng and Chung-Ling
Bought by
Cheng Family Trust
Current Estimated Value
Purchase Details
Closed on
May 31, 2001
Sold by
Lecount Ronald L
Bought by
Cheng Yung Han and Hwang Chung Ling
Home Financials for this Owner
Home Financials are based on the most recent Mortgage that was taken out on this home.
Original Mortgage
$275,000
Interest Rate
7.14%
Purchase Details
Closed on
Nov 18, 1994
Sold by
Chancellor Gail E
Bought by
Chancellor Gail E
Create a Home Valuation Report for This Property
The Home Valuation Report is an in-depth analysis detailing your home's value as well as a comparison with similar homes in the area
Home Values in the Area
Average Home Value in this Area
Purchase History
| Date | Buyer | Sale Price | Title Company |
|---|---|---|---|
| Cheng Family Trust | -- | None Listed On Document | |
| Cheng Yung-Han | -- | None Listed On Document | |
| Cheng Yung Han | $660,000 | Stewart Title | |
| Chancellor Gail E | -- | -- |
Source: Public Records
Mortgage History
| Date | Status | Borrower | Loan Amount |
|---|---|---|---|
| Previous Owner | Cheng Yung Han | $275,000 |
Source: Public Records
Tax History Compared to Growth
Tax History
| Year | Tax Paid | Tax Assessment Tax Assessment Total Assessment is a certain percentage of the fair market value that is determined by local assessors to be the total taxable value of land and additions on the property. | Land | Improvement |
|---|---|---|---|---|
| 2025 | $12,908 | $994,498 | $753,415 | $241,083 |
| 2024 | $12,908 | $974,999 | $738,643 | $236,356 |
| 2023 | $12,756 | $955,882 | $724,160 | $231,722 |
| 2022 | $12,765 | $937,140 | $709,961 | $227,179 |
| 2021 | $12,578 | $918,766 | $696,041 | $222,725 |
| 2020 | $12,340 | $909,346 | $688,904 | $220,442 |
| 2019 | $12,080 | $891,517 | $675,397 | $216,120 |
| 2018 | $11,743 | $874,037 | $662,154 | $211,883 |
| 2017 | $11,687 | $856,900 | $649,171 | $207,729 |
| 2016 | $11,336 | $840,099 | $636,443 | $203,656 |
| 2015 | $11,264 | $827,481 | $626,884 | $200,597 |
| 2014 | $10,635 | $811,273 | $614,605 | $196,668 |
Source: Public Records
Map
Nearby Homes
- 5597 Glenoak Ct
- 1154 Bentoak Ln
- 1018 Huntingdon Dr
- 5688 Kimberly St
- 1002 Oaktree Dr
- 1367 Cordelia Ave
- 5187 Doyle Rd
- 10860 Johnson Ave
- 5635 W Walbrook Dr
- 5177 Englewood Dr
- 18980 Newsom Ave
- 6117 Brigantine Dr
- 1063 Whitebick Dr
- 810 Raintree Dr
- 1335 Teresita Dr
- 18817 Tuggle Ave
- 18901 Tuggle Ave
- 915 S Tantau Ave
- 12035 Brookglen Dr
- 1083 Miller Ave
- 1129 Littleoak Dr
- 1129 Littleoak Cir
- 1125 Littleoak Cir
- 1113 Littleoak Cir
- 1131 Littleoak Cir
- 5537 Glenoak Ct
- 5549 Glenoak Ct
- 1111 Littleoak Cir
- 1128 Littleoak Cir
- 1126 Littleoak Cir
- 1130 Littleoak Cir
- 1133 Littleoak Cir
- 1124 Littleoak Cir
- 5540 Glenoak Ct
- 5561 Glenoak Ct
- 1109 Littleoak Cir
- 1132 Littleoak Cir
- 1116 Littleoak Cir
- 1114 Littleoak Cir
- 1118 Littleoak Cir