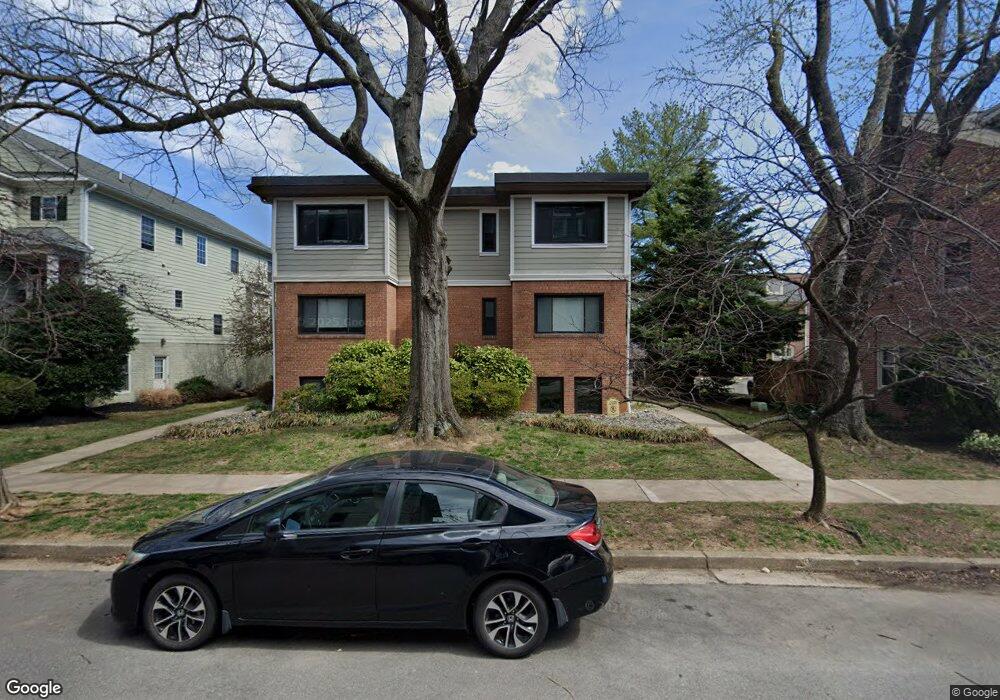
1127 N Stuart St Unit D03 Arlington, VA 22201
Ballston NeighborhoodEstimated Value: $615,000 - $743,000
2
Beds
3
Baths
1,208
Sq Ft
$550/Sq Ft
Est. Value
About This Home
This home is located at 1127 N Stuart St Unit D03, Arlington, VA 22201 and is currently estimated at $664,236, approximately $549 per square foot. 1127 N Stuart St Unit D03 is a home located in Arlington County with nearby schools including Ashlawn Elementary School, Swanson Middle School, and Washington Liberty High School.
Ownership History
Date
Name
Owned For
Owner Type
Purchase Details
Closed on
Nov 4, 2021
Sold by
Davis Anne Marie
Bought by
Soffer Brian Gregory and Soffer Alexandra Viers
Current Estimated Value
Home Financials for this Owner
Home Financials are based on the most recent Mortgage that was taken out on this home.
Original Mortgage
$535,415
Outstanding Balance
$489,861
Interest Rate
2.88%
Mortgage Type
New Conventional
Estimated Equity
$174,375
Purchase Details
Closed on
Jul 17, 2009
Sold by
Knox Wayne
Bought by
Davis Anne Marie
Home Financials for this Owner
Home Financials are based on the most recent Mortgage that was taken out on this home.
Original Mortgage
$424,297
Interest Rate
5.31%
Mortgage Type
FHA
Purchase Details
Closed on
Jun 1, 2009
Sold by
Knox Wayne
Bought by
Day Matthew P
Home Financials for this Owner
Home Financials are based on the most recent Mortgage that was taken out on this home.
Original Mortgage
$424,297
Interest Rate
5.31%
Mortgage Type
FHA
Create a Home Valuation Report for This Property
The Home Valuation Report is an in-depth analysis detailing your home's value as well as a comparison with similar homes in the area
Home Values in the Area
Average Home Value in this Area
Purchase History
| Date | Buyer | Sale Price | Title Company |
|---|---|---|---|
| Soffer Brian Gregory | $629,900 | Title Department | |
| Davis Anne Marie | $439,000 | -- | |
| Day Matthew P | $450,000 | -- |
Source: Public Records
Mortgage History
| Date | Status | Borrower | Loan Amount |
|---|---|---|---|
| Open | Soffer Brian Gregory | $535,415 | |
| Previous Owner | Davis Anne Marie | $424,297 | |
| Previous Owner | Day Matthew P | $300,000 |
Source: Public Records
Tax History Compared to Growth
Tax History
| Year | Tax Paid | Tax Assessment Tax Assessment Total Assessment is a certain percentage of the fair market value that is determined by local assessors to be the total taxable value of land and additions on the property. | Land | Improvement |
|---|---|---|---|---|
| 2025 | $6,494 | $628,700 | $93,000 | $535,700 |
| 2024 | $6,142 | $594,600 | $93,000 | $501,600 |
| 2023 | $6,075 | $589,800 | $93,000 | $496,800 |
| 2022 | $5,469 | $531,000 | $93,000 | $438,000 |
| 2021 | $5,469 | $531,000 | $93,000 | $438,000 |
| 2020 | $5,040 | $491,200 | $60,400 | $430,800 |
| 2019 | $5,040 | $491,200 | $60,400 | $430,800 |
| 2018 | $4,816 | $478,700 | $60,400 | $418,300 |
| 2017 | $4,733 | $470,500 | $60,400 | $410,100 |
| 2016 | $4,663 | $470,500 | $60,400 | $410,100 |
| 2015 | $4,686 | $470,500 | $60,400 | $410,100 |
| 2014 | $4,419 | $443,700 | $60,400 | $383,300 |
Source: Public Records
Map
Nearby Homes
- 1138 N Stafford St
- 4207 11th St N Unit 1
- 4103 11th Place N
- 1050 N Taylor St Unit 1105
- 1050 N Taylor St Unit 1201
- 1050 N Taylor St Unit 1407
- 1024 N Utah St Unit 522
- 1024 N Utah St Unit 524
- 1000 N Randolph St Unit 806
- 1001 N Vermont St Unit 102
- 1001 N Vermont St Unit 108
- 1001 N Vermont St Unit 811
- 1001 N Randolph St Unit 215
- 1109 N Vernon St
- 900 N Stafford St Unit 915
- 900 N Stafford St Unit 1117
- 900 N Taylor St Unit 2026
- 900 N Taylor St Unit 2006
- 900 N Taylor St Unit 2105 & 2107
- 900 N Taylor St Unit 606
- 1127 N Stuart St Unit 7
- 1127 N Stuart St Unit 3
- 1127 N Stuart St Unit 2
- 1127 N Stuart St Unit 301
- 1127 N Stuart St Unit 304
- 1127 N Stuart St Unit D02
- 1127 N Stuart St Unit D01
- 1127 N Stuart St Unit 302
- 1127 N Stuart St Unit 303
- 1127 N Stuart St Unit D04
- 1127 N Stuart St Unit 6
- 1127 N Stuart St Unit 5
- 1127 N Stuart St Unit 8
- 1127 N Stuart St Unit 4
- 1127 N Stuart St Unit 1
- 1127 N Stuart St
- 1133 N Stuart St
- 1125B N Stuart St
- 1125 N Stuart St
- 1123 N Stuart St